
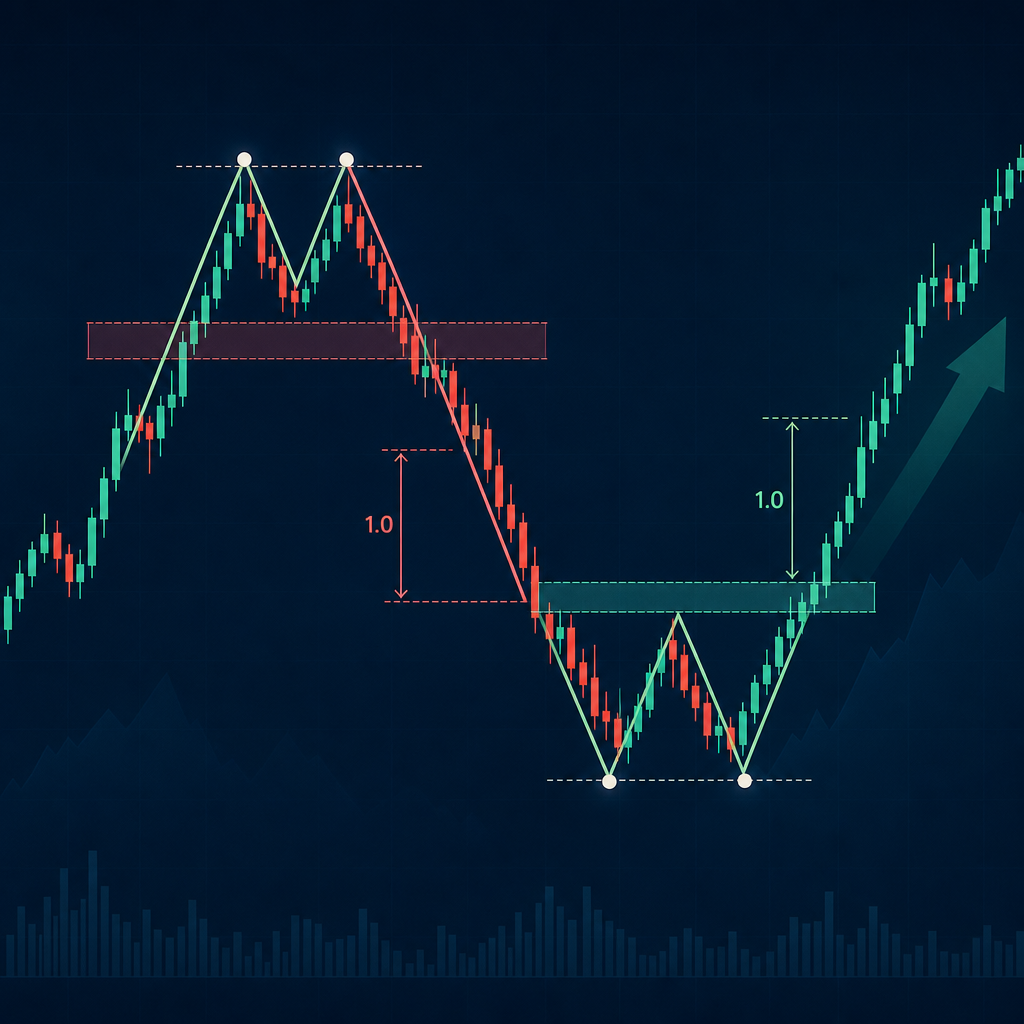
Double tops and double bottoms look simple in hindsight. Two peaks suggest resistance, while two troughs suggest support. In live markets, however, the two turning points rarely occur at exactly the same price, and the pattern can change as new candles form.
That is why traders usually mark the turning points as a zone rather than a precise horizontal line. A more systematic approach is to use zigzag swing logic, candle-body prices, ratio filters and multiple lookback lengths. Neostox brings these elements together so traders can select and deploy the pattern, then watch potential formations update during runtime instead of drawing every swing manually.
What Is a Double Top Pattern?
A double top is a potential bearish reversal structure that develops after an upward move. Price forms an initial peak, declines to a swing low, rises toward the earlier peak and then turns down again.
The swing low between the two peaks is commonly called the neckline. The pattern is not confirmed merely because two peaks are visible. Traders generally look for price to break and close below the neckline before treating the structure as a completed double top.
Basic double top sequence
- An existing upward move establishes bullish context.
- Price creates the first swing high.
- A meaningful pullback forms the neckline.
- Price rallies again and creates a second high near the first.
- A decisive move below the neckline confirms the bearish structure.
What Is a Double Bottom Pattern?
A double bottom is the bullish counterpart. It generally forms after a decline, when price creates one swing low, rebounds, falls toward the earlier low and then recovers again.
The swing high between the two lows acts as the neckline. Confirmation normally requires a breakout and close above that level. Buying only because the second low resembles the first can be premature because the downtrend may still continue.
Basic double bottom sequence
- An existing downward move provides the reversal context.
- Price creates the first swing low.
- A rebound establishes the neckline.
- Price declines again and forms a second low near the first.
- A decisive move above the neckline confirms the bullish structure.
Why Exact Double Tops and Bottoms Are Rare
Markets do not usually reverse at the same price down to the last tick. Volatility, liquidity, stop orders and intraday price rejection can cause the second turning point to undershoot or overshoot the first.
This is why drawing a rectangle around the two peaks or troughs is often more realistic than expecting a perfect horizontal match. The zone must still be defined objectively. If it is widened whenever the market invalidates the original idea, almost any chart can be made to resemble a double top or bottom.
A useful detector therefore needs a measurable tolerance. That tolerance can be based on price distance, volatility or the proportional relationship between the relevant swing legs.
Using Ratio Filters to Measure Pattern Symmetry
Ratio filters help determine whether the second swing is sufficiently similar to the first. In one practical configuration, a proportional range of approximately 81% to 111.1% can be used to accept a near-match between the measured swing legs or pattern depths.
This means the second move does not have to equal the first exactly. It can be moderately smaller or slightly larger and still qualify as a candidate formation. The calculation must be applied consistently to the same swing measurements; simply dividing one absolute stock price by another is not a robust pattern test.
The 81% to 111.1% range should be treated as a configurable symmetry band, not as a universal market law. Despite sometimes being grouped with Fibonacci-based analysis, these exact boundaries are not standard Fibonacci retracement levels. Traders should test the band on the instrument, timeframe and trading style they use.
High-Low Prices Versus Open-Close Prices
Most chart patterns are identified using candle highs and lows. This captures the full traded range, including intraday rejection. The drawback is that a brief wick can create a swing point that exaggerates the underlying structure.
An alternative is to calculate swings from the candle body using open and close prices. For tops, the higher body price can represent the candle-body extreme; for bottoms, the lower body price can be used. This method filters some wick-driven noise and may produce cleaner-looking formations.
Open-close detection is not automatically superior. Wicks can contain meaningful information about failed breakouts, liquidity sweeps and strong rejection. The choice depends on what the trader wants to measure:
- High-low swings: More sensitive and responsive, but more exposed to isolated spikes.
- Open-close swings: Smoother and less affected by wicks, but capable of ignoring genuine rejection levels.
The important point is consistency. Do not identify the pattern with candle-body prices and then quietly change to wick prices only when it makes the setup look better.
Why Zigzag Logic Matters
A zigzag process reduces minor fluctuations and connects meaningful swing highs and lows. This makes it useful for finding the alternating pivots required by double-top and double-bottom structures.
The difficult part is choosing how sensitive the zigzag should be. A highly sensitive setting can produce too many pivots and false formations. A slow setting may ignore a valid short-term reversal until much later.
A practical zigzag detector must address:
- The minimum movement needed to create a new pivot.
- Whether pivots are calculated from highs and lows or opens and closes.
- How an unfinished swing is updated when new prices arrive.
- How much variation is allowed between the two tops or bottoms.
- Which lookback lengths are monitored.
The latest zigzag point can move until a reversal is established. Traders should therefore distinguish between a developing pattern and a confirmed pattern. A shape visible during runtime can disappear before confirmation.
One Pattern Can Exist Across Multiple Lookbacks
A double top or bottom may be obvious on a short lookback but hidden within a larger market swing. The reverse is also possible: a chart may show no immediate pattern using fast pivots while a broader structure is developing over a longer lookback.
This creates a genuine detection problem. Using only one zigzag sensitivity gives the trader a narrow view. Using too many settings without filters can flood the chart with overlapping signals.
A better process is to monitor selected short, medium and long lookbacks, then rank formations by context and confirmation. A pattern that appears across more than one meaningful lookback may deserve attention, but agreement alone does not guarantee a profitable trade.
Automating Runtime Detection with Neostox
Manually testing candle-body prices, zigzag sensitivities, ratio bands and multiple lookbacks is time-consuming. It also introduces hindsight bias because swing points often appear obvious only after the move is complete.
Neostox allows users to select and deploy double-top and double-bottom pattern logic and observe formations as they develop during runtime. The programmed workflow handles the repetitive work of plotting pivots, comparing the relevant swings and monitoring different lookback possibilities. This is the central advantage: traders can study how the setup behaves live without repeatedly redrawing zones by hand.
Automation improves consistency, not certainty. It cannot turn an unconfirmed pattern into a guaranteed reversal. Traders should still check the prevailing trend, neckline confirmation, liquidity, position size and invalidation level. Testing the logic in a simulated environment before risking capital can also reveal whether the selected settings suit the instrument.
How to Trade the Pattern More Systematically
- Check the preceding trend: A double top is more relevant after an advance, while a double bottom is more relevant after a decline.
- Identify meaningful pivots: Use a defined zigzag method rather than selecting convenient chart points retrospectively.
- Apply the tolerance consistently: Compare the two swing structures using the same price basis and ratio formula.
- Mark the neckline: Use the intervening trough for a double top and the intervening peak for a double bottom.
- Wait for confirmation: A neckline close is generally more meaningful than a brief intraday breach.
- Define invalidation: The stop can be planned beyond the relevant second peak or trough, with room for normal volatility.
- Assess reward versus risk: A conventional target projects the pattern height from the neckline, but it should be treated as a reference rather than a promise.
Common Mistakes to Avoid
- Calling any two nearby highs or lows a reversal pattern.
- Ignoring the trend that existed before the formation.
- Using an excessively wide zone to preserve a weak setup.
- Entering before the neckline breaks.
- Treating an unfinished zigzag pivot as fixed.
- Changing between wick and candle-body prices without a rule.
- Assuming a ratio filter guarantees pattern quality.
- Using the same lookback and tolerance on every instrument without testing.
Final Takeaway
Double tops and bottoms are better understood as structured zones than as perfectly equal price levels. Zigzag logic can identify the required pivots, open-close calculations can reduce wick noise, and ratio filters can define how similar the two swings need to be. Multiple lookbacks matter because the same formation can exist at different market scales.
The practical benefit of Neostox is that this process can be selected, deployed and watched during runtime. That reduces manual plotting and makes the rules more consistent. The final trading decision, however, should still depend on confirmation and disciplined risk management rather than the pattern label alone.