
Attention
I still remember the exact moment I got fed up. I had four indicators stacked on a Nifty 5-minute chart, RSI, MACD, a volume profile, and a custom moving average ribbon, and TradingView's free plan stopped me cold. "Upgrade to add more indicators." I wasn't trying to do anything fancy. I just wanted to see what I always see before I take a trade.
If you've spent real time on a charting platform, you've probably hit a wall like that too. Maybe it wasn't the indicator cap. Maybe it was the watermark stamped across every screenshot you tried to share with your trading group. Maybe it was opening the replay feature to backtest a setup and finding out it's locked behind a paywall you weren't expecting.
Interest
None of these are dealbreakers on their own. But add them up over a few months of daily charting, and they start to feel like friction you shouldn't have to deal with just to look at price.
Take the pricing. TradingView bills in dollars, and for a lot of Indian traders, that means paying a premium just for currency conversion on top of the subscription itself. I did the math once for a plan that unlocked more indicators and alerts, and after the conversion and the annual commitment, it worked out to more than I was paying my broker in monthly fees. For a tool that's supposed to sit underneath your trading, not replace it, that's a strange place to end up.
Then there's the data itself. NSE and BSE aren't the platform's home market, so on faster time frames I noticed small lags between what my broker's terminal showed and what my chart showed. A few seconds doesn't sound like much until you're watching a breakout candle close and your chart is still catching up.
Desire
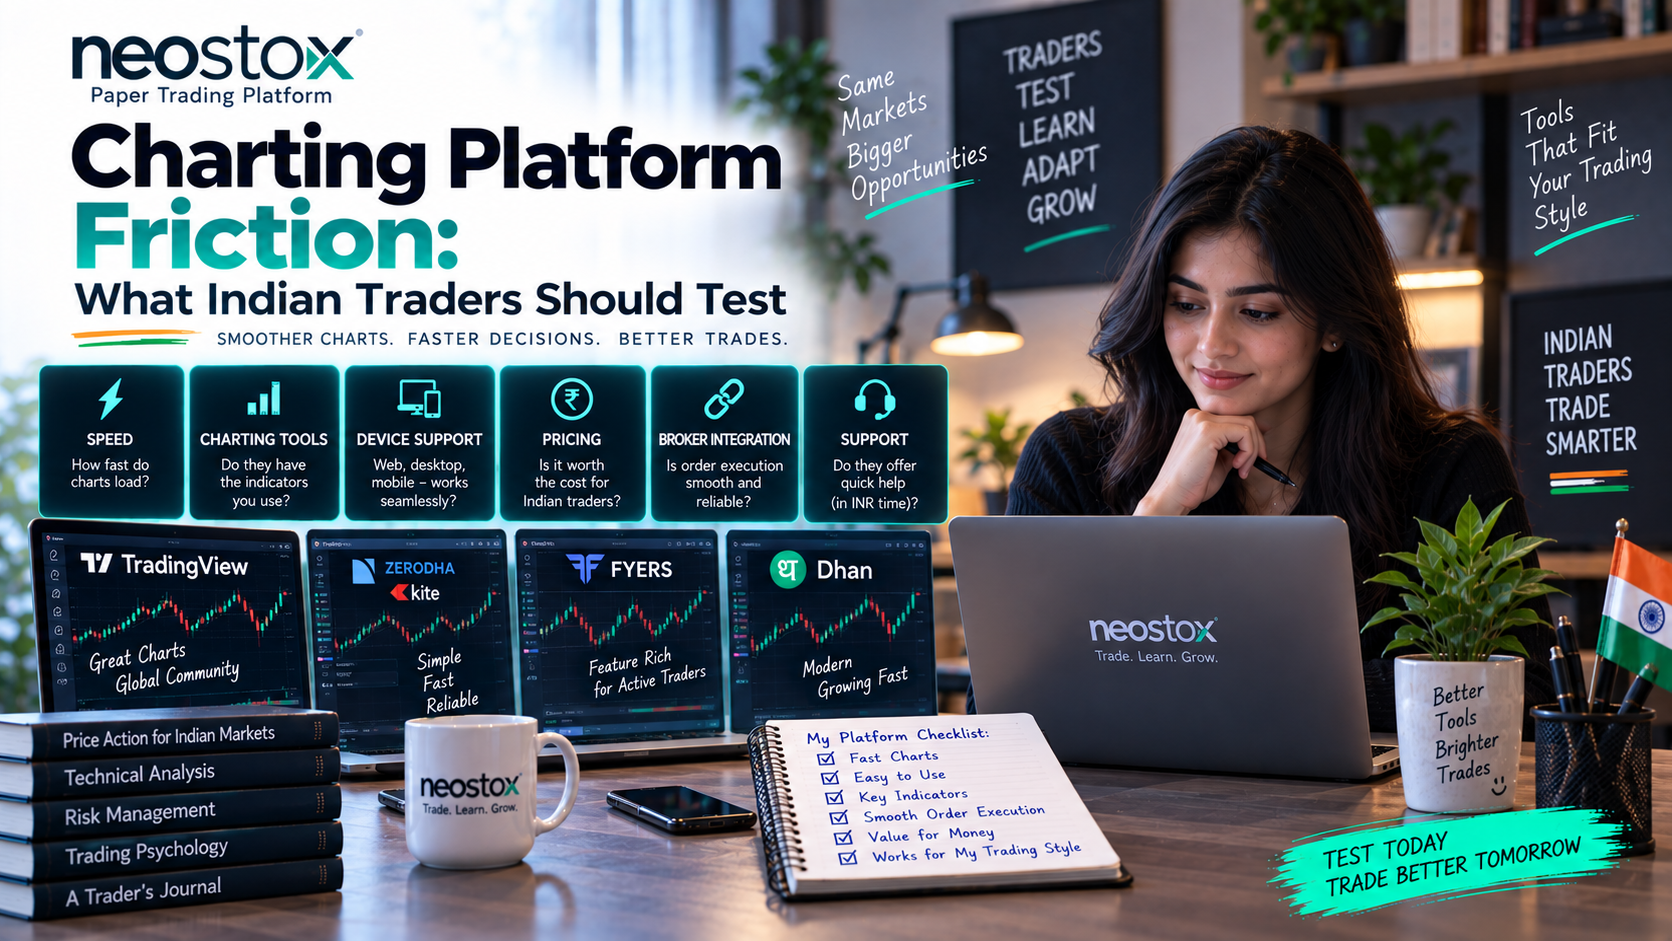
This is exactly the gap a charting system built around Indian markets and Indian traders can close. Instead of retrofitting a global platform to work for NSE and BSE data, a system designed with that data from the start doesn't need you to pay extra just to see your own market clearly.
Picture your usual setup: multiple indicators stacked without a paywall stopping you mid-analysis, a clean chart you can screenshot and share without a watermark competing for space, and pricing that doesn't require you to do currency math before you commit. Add a replay tool that's actually part of the package, not an upsell, and you can walk back through last week's price action and test your read without opening a separate app or paying for a separate tier.
That's the kind of charting experience Neostox's charting system is built around. It's made for traders who live on the chart every day and don't want their platform working against them while they do it.
Action
If any of this sounds familiar, the indicator caps, the watermark, the replay feature you can't reach, it's worth spending twenty minutes on Neostox's charting system and seeing whether those specific frustrations disappear. Pull up a stock you know well, stack your usual indicators, and see how it holds up. You'll know within a few charts whether it fits how you actually work.