
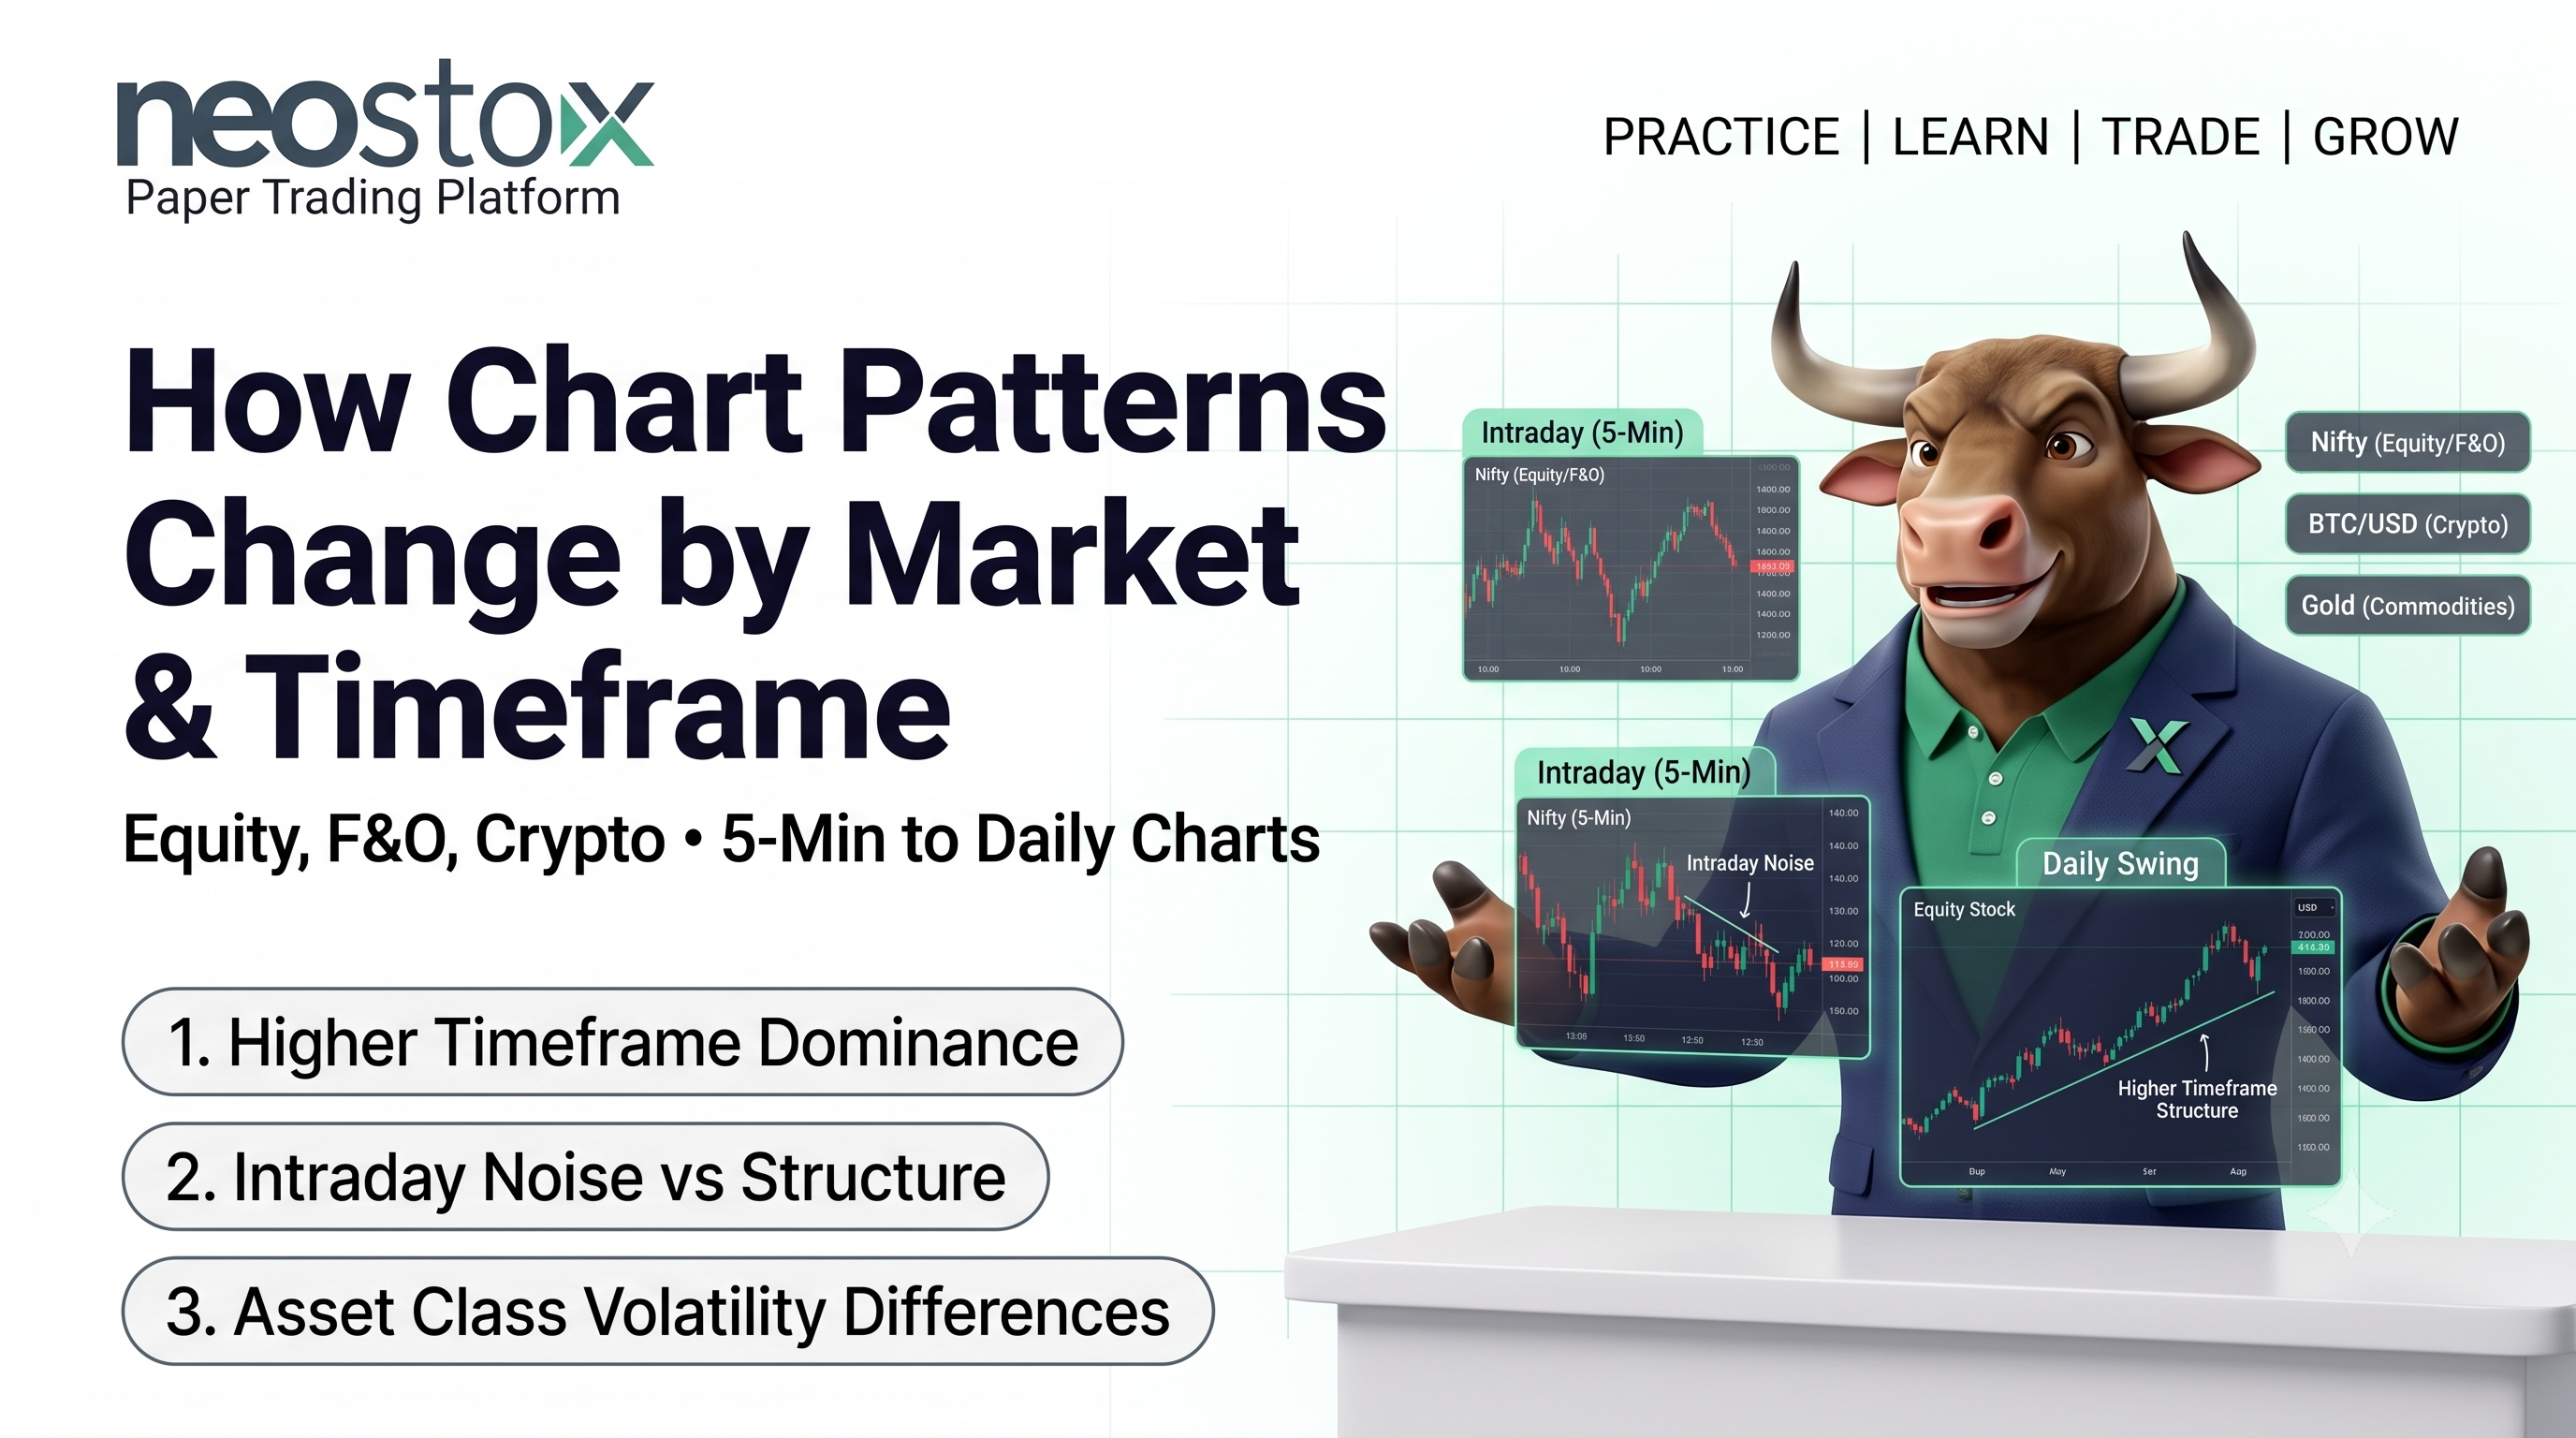
The same named pattern doesn't mean the same thing everywhere. A triangle on a 1-minute chart and a triangle on a weekly chart come from very different amounts of aggregated trading activity. A pattern read on stocks doesn't automatically behave the same way in a market with different liquidity, trading hours, and participants, like crypto or forex. This page walks through what actually changes, and why, across day trading, swing trading, forex, crypto, and options.
What changes with timeframe?
Shorter timeframes compress far less genuine activity into each price bar. A 1-minute candle reflects a tiny slice of trading. Normal, low-significance order flow can visually resemble structure that would never register as meaningful on a daily chart. That's a mechanical fact about how much activity gets packed into each bar. It's not a claim that one timeframe is "better."
Longer timeframes aggregate more activity into each bar. A swing high or low on a daily or weekly chart reflects a broader stretch of buying and selling decisions. This is why the same structural rules from earlier guides, genuine touches, reasonable formation duration, matter even more on shorter timeframes. The noise-to-signal ratio is structurally higher there.
Day trading
Day trading typically works with very short timeframes, 1-minute, 5-minute, sometimes tick-based charts, covered in a companion guide. Patterns need to confirm quickly, within the same session. That leaves little room for the kind of extended, multi-week formation a swing trader can wait out patiently.
Shorter timeframes carry more noise relative to genuine structure. That means volume confirmation matters proportionally more here, not less. A breakout on a 5-minute chart without real volume is easier to mistake for a genuine signal than the same weak breakout on a daily chart. There's simply less aggregated activity backing any single short-term move.
Swing and positional trading
Swing and positional trading generally works with daily and weekly charts. That gives patterns more time to form from genuinely significant points rather than short-term noise. This extra time doesn't guarantee better outcomes, no specific accuracy figure is claimed here. But it does mean each touch of a boundary reflects more aggregated trading decisions than the same touch would on an intraday chart.
Measured-move targets, covered in a companion guide, have more room to play out over the multi-week horizons typical of swing and positional trading. Day trading's compressed timeframes don't offer that same room.
Forex
Two structural factors matter here. First, for Indian traders, legal currency trading is limited to specific INR-paired contracts, USD/INR, EUR/INR, GBP/INR, and JPY/INR, through SEBI-registered exchanges. A companion guide covers this regulatory constraint in full. Understand it before applying anything here to global forex pairs directly.
Second, forex trades across overlapping global sessions, Asian, European, US, rather than one fixed exchange session the way Indian equities do. That changes how concepts like session-based gaps apply, since there's rarely a full market-wide close the way equities experience overnight.
Round psychological price levels, whole and half-figure exchange rates, are commonly observed acting as informal support or resistance in currency markets. This is a widely discussed feature of how currency pairs get quoted and traded. Factor it in when you're deciding where a pattern's boundaries should actually sit.
Crypto
Crypto markets trade continuously, 24 hours a day, without the session breaks equity markets have. That changes how gap-based concepts apply, since there's no equivalent overnight close. A companion guide on equity markets covers gap risk in that specific context. Liquidity and who's actually trading also vary considerably across different crypto exchanges and pairs, more than is typical across major, centrally listed equity markets. The same nominal pattern shape can carry different structural weight depending on which exchange and pair's data you're looking at.
None of this means patterns behave better or worse in crypto specifically. No comparative study is cited here to support that claim. It means the assumptions behind pattern reliability, genuine aggregated participation, consistent liquidity, need checking in crypto's specific context. Don't assume they carry over automatically from equity markets.
Options
Here's a genuinely important, often-overlooked distinction. When looking for a chart pattern to inform an options trade, analyze the underlying stock or index's price chart. Don't analyze the option's own premium chart. An option's premium is affected by factors beyond the underlying's price movement, time decay, changes in implied volatility, covered in a companion guide on options mechanics. Both distort what a "pattern" on the premium chart would actually represent.
The underlying's price chart reflects the same supply-and-demand structure that chart pattern analysis is built around. Identify your setup there. Then use options as the instrument to express that view. Don't search for chart patterns directly on the option's own price history, since that mixes in variables that have nothing to do with the pattern concept itself.
Liquidity and volatility considerations
Thinly traded instruments, small-cap stocks, low-volume crypto pairs, illiquid options contracts, produce structure that's more easily driven by a small number of orders rather than genuine broad participation. That weakens how much confidence a pattern's touches actually deserve, compared to the same shape on a heavily traded instrument. Higher-volatility instruments generally need wider criteria, a bigger minimum move to count as a genuine touch or breakout. Normal volatility alone can otherwise trigger false signals, a concept covered through ATR in a companion guide on indicators.
Choosing appropriate confirmation
Noisier contexts, short intraday timeframes, thinly traded instruments, crypto pairs with fragmented liquidity, generally call for stricter confirmation. Real volume behind a breakout matters more here, and in some cases, waiting for a retest beats acting on the initial break. Less noisy contexts, liquid large-cap stocks on daily charts, still benefit from the same confirmation discipline. The structural noise floor there is just lower to begin with.
Market and timeframe reference
| Context | Typical timeframe | Main structural difference | Confirmation emphasis |
|---|---|---|---|
| Day trading | 1-minute to 15-minute | High noise relative to aggregated participation | Volume confirmation especially important |
| Swing / positional | Daily, weekly | More aggregated participation per structural point | Standard confirmation, more room for retest |
| Forex | Varies, 24-hour session structure | No single fixed market close; round-number levels commonly observed | Session and liquidity context matter |
| Crypto | Varies, continuous 24/7 trading | No session gaps; liquidity varies sharply by exchange/pair | Check liquidity of the specific pair/exchange |
| Options | N/A, analyze the underlying instead | Premium distorted by time decay and volatility | Confirm the pattern on the underlying's chart |
Seeing how the same pattern concept behaves across different instruments and timeframes sinks in faster through direct comparison than through description alone. Neostox's charting tools cover equities, futures, and options on live NSE and BSE market conditions across multiple timeframes. Paper trading lets you test how confirmation and structure genuinely differ by context, with virtual money, before it matters with real capital.