
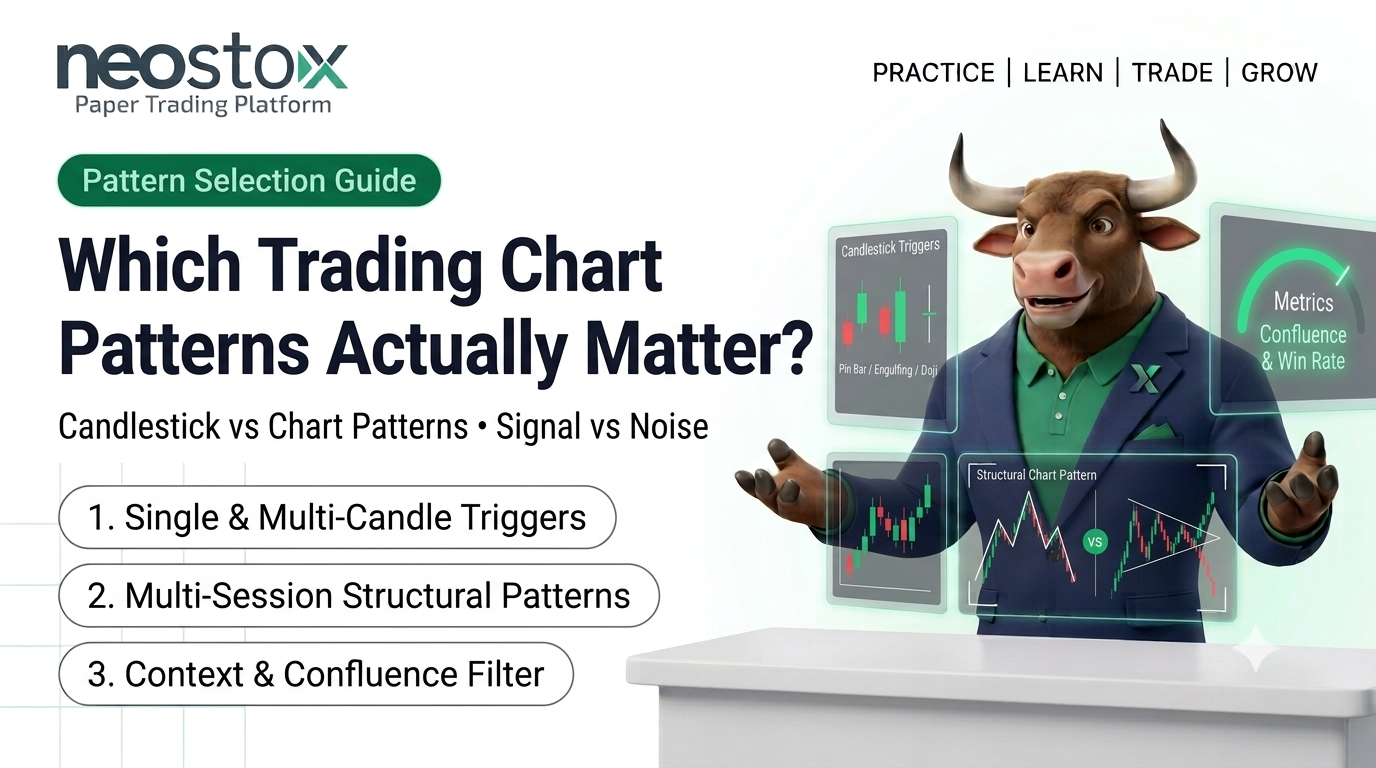
Candlestick patterns and chart patterns are related but distinct tools. A candlestick pattern forms from one to three bars and signals short-term sentiment. A chart pattern forms from many bars over a longer stretch and signals a broader structural setup. Neither has a single, universally agreed "most reliable" member, despite how often that claim shows up online. What actually matters is learning a small, well-defined set of each, applying them with real confirmation rules, and treating every signal as probabilistic, not predictive.
Do stock prices follow repeatable patterns?
Not in a strict, mechanical sense, but not purely randomly either. Prices reflect the collective behavior of people reacting to similar conditions in broadly similar ways, which is why certain shapes recur often enough to study. Some rigorous, algorithmically-defined research has found statistically distinguishable price behavior associated with specific patterns in specific historical samples. That's a real, documented tendency. It's a different, weaker claim than saying any pattern reliably predicts what happens next, and a full breakdown of that distinction sits in a dedicated evidence-review guide linked at the end of this page.
Candlestick patterns vs chart patterns: what's the actual difference?
This distinction gets blurred constantly, so it's worth being precise about it.
- Candlestick patterns form from a single candle or a short sequence of two or three, and are generally read as a short-term sentiment signal, momentum building, fading, or reversing within the next few periods. A doji, a hammer, or an engulfing pattern are all candlestick patterns.
- Chart patterns form over many candles, sometimes weeks, and describe a broader structural setup, a head and shoulders, a triangle, a flag. They're read as a longer-horizon, structural signal rather than a short-term sentiment cue.
Neither replaces the other. Many traders use chart patterns to identify the broader setup, then watch for a candlestick signal to time entry within that setup, rather than treating the two as competing systems.
Which candlestick patterns should beginners learn?
Rather than memorizing dozens of named shapes, a small, well-defined starting set covers most situations a beginner will actually encounter.
- Doji, a candle with a tiny body, open and close nearly equal, generally read as indecision rather than a directional signal on its own.
- Hammer / Hanging Man, a small body with a long lower wick, read as a potential reversal signal depending on whether it appears after a decline (hammer) or an advance (hanging man).
- Bullish / Bearish Engulfing, a two-candle pattern where the second candle's body fully covers the first, widely cited in candlestick literature as one of the stronger short-term reversal signals, though "stronger" here reflects convention, not a verified comparative accuracy figure.
- Morning Star / Evening Star, a three-candle reversal sequence, covered below under the three-candle convention.
Learn these few properly, with their actual formation rules, rather than a long list learned loosely. A small set applied correctly beats a large set applied vaguely.
Which chart patterns should traders learn?
A similarly small, well-defined set covers most of what shows up in practice: Head and Shoulders and its inverse, Double Top and Double Bottom, the main triangle variants, Flags and Pennants, and Cup and Handle. A full breakdown of each, with structure, confirmation, and invalidation rules, sits in the pattern-inventory and trading-playbook guides linked below. This page focuses on evaluation, not re-teaching each pattern's mechanics.
How do you identify and trade chart patterns?
In short: context first, then structure, then confirmation, then a planned entry, invalidation, and exit, decided in advance rather than reacted to in the moment. That full process, with a pre-trade checklist and worked examples, is covered step by step in a dedicated guide on building a strategy around chart patterns, linked below. This page isn't a substitute for that process, it's meant to help you evaluate which patterns are worth learning in the first place.
Which pattern is most reliable or most profitable?
No specific named pattern, candlestick or chart, has well-supported, replicated evidence establishing it as uniquely "most reliable" or "most profitable." Reported accuracy figures for any single pattern vary enormously across sources, almost entirely because of differences in how the pattern gets defined and tested, not because of a genuine, settled finding about the market. A dedicated evidence-review guide walks through exactly why these figures vary so much, and how to check one yourself before trusting it.
Treat any confident "X% accurate" claim about a specific pattern, candlestick or chart, as something to verify against its actual methodology, not something to accept because it's repeated often.
Which candlestick is strongest or most bullish?
Within standard candlestick convention, the bullish engulfing pattern and the morning star are both widely cited as among the stronger bullish reversal signals, since each reflects a clear shift from selling pressure to buying pressure across the candles involved. That's a statement about convention and widely shared interpretation, not a verified comparative accuracy ranking. Context, where the pattern appears, what volume accompanies it, what the broader trend looks like, matters at least as much as which specific candlestick shape formed.
What is the 3-candlestick rule?
The "3-candlestick rule" isn't a single, formally standardized rule the way exchange regulations are. It's an informal convention used two overlapping ways. First, several well-known reversal patterns, the morning star, the evening star, three white soldiers, three black crows, are themselves built from exactly three candles, so recognizing a pattern often means watching a specific three-candle sequence complete. Second, some traders use "wait three candles" informally as a personal confirmation habit, giving a potential signal a short window to either confirm or fail before acting. Treat it as a useful convention worth understanding, not a universal, formally agreed rule every trader follows identically, similar to how the "3-5-7" position-sizing convention covered in a companion risk-management guide isn't standardized across every trading community either.
How should beginners actually learn patterns?
Start with a small set, the four or five candlestick patterns and handful of chart patterns listed above, and learn each one's actual, mechanical formation rules before trying to trade off it. Practice spotting them on historical and live charts without placing a single trade, purely as a recognition exercise. Once recognition is solid, layer in confirmation and risk rules, covered in the recognition and playbook guides linked below, before risking real capital. Paper trading is a genuinely useful way to practice this entire sequence, pattern recognition, confirmation, and risk management together, with virtual money first.
Does Elliott Wave still work?
Elliott Wave Theory, which describes price as moving in a repeating sequence of five impulse waves followed by three corrective waves, remains widely used by some discretionary traders and widely criticized by others, and that split hasn't resolved. The core criticism is subjectivity, different analysts applying Elliott Wave to the same chart frequently count the waves differently, which makes the theory difficult to test or verify in the same rigorous, replicable way algorithmically-defined patterns can be tested. That doesn't mean no one finds it useful as a personal framework. It does mean no well-supported, independently replicated evidence establishes it as a reliably predictive method, and any specific claim built on a particular wave count should be treated the same way as any other unverified pattern claim on this page, with real skepticism until checked.
Candlestick vs chart pattern quick comparison
| Candlestick patterns | Chart patterns | |
|---|---|---|
| Formed from | 1 to 3 candles | Many candles over a longer stretch |
| Typical signal | Short-term sentiment shift | Broader structural setup |
| Example | Engulfing, Doji, Morning Star | Head and Shoulders, Triangle, Flag |
| Best used for | Timing entry within a setup | Identifying the setup itself |
| "Most reliable" member | Not established by replicated evidence | Not established by replicated evidence |
Recognizing a pattern on a screenshot is one thing. Recognizing it on a live, moving chart, under real conditions, is a different skill that only builds with repetition. Neostox's charting tools cover equities, futures, and options on live NSE and BSE market conditions, and paper trading lets you practice both candlestick and chart pattern recognition with virtual money before any of it involves real capital.