
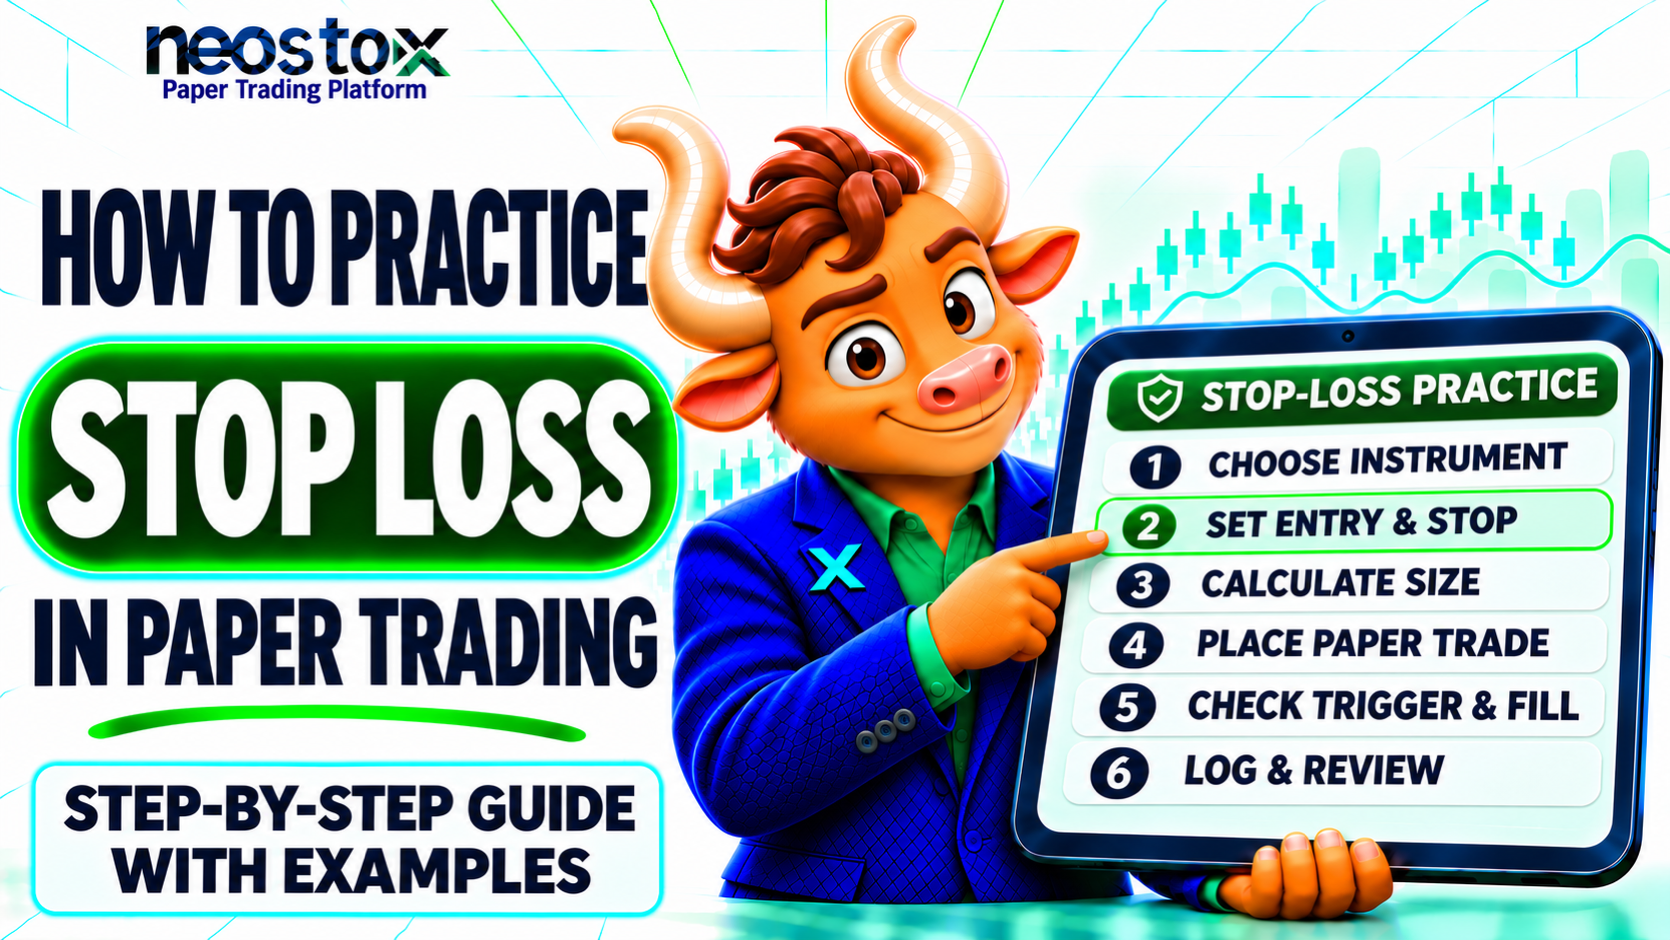
This guide walks through each step with one rupee example and stress-tests stops against gaps and slippage. It also explains what a simulator cannot show. All figures are hypothetical and for education only.
How Can You Practice Stop Loss in Paper Trading? (Quick Answer)
Repeat this six-step loop for every practice trade:
- Open a paper-trading account that supports stop orders.
- Choose an entry and a stop price where your trade idea fails.
- Divide your risk budget by the stop distance to get the quantity.
- Place the order with the stop attached.
- Watch the trigger and note the simulated fill, including any slippage.
- Log the result and calculate your R-multiple.
What Does Practicing Stop Loss in Paper Trading Mean?
Practicing stop loss in paper trading means rehearsing a protective exit with virtual money. You plan the stop, size the trade, place the order, watch it trigger, and review the outcome. The goal is not virtual profit. It is a repeatable habit of defining risk before you enter. For example, you might run a set of practice trades that each risk the same ₹1,000, then check how often you followed your own rules. A simulator cannot reproduce live-market pressure, so treat it as a process lab, not a forecast.
What Is a Stop-Loss Order?
A stop-loss order is an instruction to buy or sell once the price reaches a trigger level you set. For a long position, it is a sell order below the current price. For a short position, it is a buy order above it. A stop-market order then becomes a market order. A stop-limit order becomes a limit order, which may not fill. Indian platforms often label these SL-M and SL, so check the names on your order ticket.
Paper Trading vs. Live Stop-Loss Execution
A simulator teaches order mechanics, but it may not copy live execution. Check your platform's documentation to see how it fills orders.
| Factor | Paper trading | Live trading |
|---|---|---|
| Fills | Set by the simulator's rules and price feed | Matched against real orders |
| Slippage | Often small or absent | Can be large in fast or thin markets |
| Costs | May be ignored | Brokerage, taxes and charges apply |
| Order queue | Rarely modeled | Your order waits behind others at the same price |
| Partial fills | Often filled in full | Orders may fill in parts |
| Pressure | Low | Real money affects decisions |
What Do You Need Before Practicing?
You need four things before your first practice trade:
- A paper-trading account with stop or stop-limit orders
- A chart with your chosen timeframe
- A starting balance you can set or reset
- A journal, even a simple spreadsheet
Set these up once and reuse them, so your results stay comparable from trade to trade.
Choose a Paper-Trading Platform That Supports Stop-Loss Orders
Simulators handle protective orders differently. Check these points first:
- Order types: Are stop and stop-limit orders available for your instrument?
- Attached exits: Can you add a stop and target when you place the entry?
- Status display: Does it show when a stop is working, triggered or filled, and can you screenshot it?
- Data: Is the price feed real-time or delayed?
Neostox's paper trading platform lets you practice stocks, futures and options with virtual money and delayed price data. The Neostox FAQs state that prices are delayed by 30 days, so use it to practice process, not market timing. Check its order ticket against the list above before you rely on it for stop-loss practice. Features differ by platform. On TradingView, for example, take-profit and stop-loss attach only to market or limit entries.
Set Virtual Capital and Define Your Risk Rules
Set a starting balance close to what you might trade later. This guide uses ₹1,00,000 as an illustration only. Then write your rules before the first trade:
- Risk per trade: 1% of capital, or ₹1,000 (illustrative, not a recommendation)
- Maximum open trades: decide a fixed number
- Daily loss limit: decide a rupee amount
- Stop changes: never move a stop further from entry
Replace these numbers with your own, then keep them constant for the whole exercise. If you change rules halfway, you cannot tell whether a better result came from skill or from looser rules.
How to Practice Stop-Loss Orders Step by Step
Each practice trade follows the same six steps: choose the instrument, set entry and stop, size the position, place the order, watch the trigger and fill, then review. Follow them in order. Skipping the calculation or the review removes most of the learning.
Step 1: Select an Instrument and Trading Timeframe
Pick one liquid NSE-listed stock and one timeframe, such as the daily or 15-minute chart. Avoid thinly traded stocks, since they make fills harder to judge. Stay with both choices for the whole exercise. Timeframe matters because stop distance grows with chart size. A stop that suits a daily chart can be far too wide for a five-minute trade. Write down the symbol, timeframe and date so you can reproduce the exercise. Check that your simulator shows the price feed for that stock.
Step 2: Identify Entry Price and Stop-Loss Level
Place the stop where the trade idea is proven wrong, not where a loss feels comfortable. For a long trade, that is often just below a recent swing low or support level. Add a small buffer so routine noise does not trigger it.
In our example, a stock trades at ₹500 and its swing low is ₹493. You plan to buy at ₹500 with a stop at ₹490. If the price falls to ₹490, the setup has failed. Write that reason in your journal.
Run two quick checks. Is the stop distance realistic for this timeframe? Does it leave room for a target larger than the risk? If not, skip the trade and note why. Skipping is a valid practice result.
Step 3: Calculate Risk and Position Size
Position size links your stop to your risk budget:
Quantity = Risk budget ÷ |Entry price − Stop price|
With ₹1,00,000 capital and a 1% risk budget of ₹1,000: ₹1,000 ÷ (₹500 − ₹490) = 100 shares. Round down if the answer has decimals. Neostox trading course describes the same link between the amount you risk, your stop distance and your position size.
Now check the position value: 100 × ₹500 = ₹50,000, half the account. If that exceeds your available balance, reduce the quantity. This calculation excludes brokerage, taxes and charges, so a real stop-out would cost slightly more than ₹1,000.
Try the formula with other stop distances. A ₹20 distance gives ₹1,000 ÷ ₹20 = 50 shares. A ₹5 distance gives 200 shares, a ₹1,00,000 position that uses the whole account. A tighter stop does not shrink risk by itself. It can simply enlarge the position.
Step 4: Place the Paper Trade and Attach a Stop-Loss
Open the order ticket. Field names differ by platform.
- Choose Buy and enter 100 as the quantity.
- Select an entry type: limit at ₹500, or market.
- If the ticket allows attached exits, enter a stop-loss at ₹490 and a take-profit at ₹520.
- Review the preview and confirm the planned loss is about ₹1,000.
- Submit, then check the order status.
- Save a dated screenshot of the ticket and the working order.
If you cannot attach a stop at entry, wait for the entry to fill and place a separate sell stop at ₹490. Do not confuse this with a buy stop placed above the market to enter a breakout. That is an entry order, not protection.
Step 5: Monitor When the Stop Triggers and Fills
When price touches ₹490, the stop triggers. A stop-market order then sells at the next available price, which may differ from ₹490. A stop-limit order sells only at your limit price or better. Record the trigger time, the fill price and the gap between stop and fill. If your simulator always fills exactly at ₹490, it may understate slippage. Treat that result as optimistic and run the stress tests below.
Also check what triggers the stop. Some platforms use the last traded price. Others use bid and ask quotes.
Step 6: Record Outcome and Review Your Decision
Log the trade right away. Record entry, stop, quantity, exit, net result and R-multiple, which is profit or loss divided by planned risk. Then ask:
- Did I place the stop before doing anything else?
- Did I move it?
- Did the fill match the plan?
A hypothetical row might read: long, ₹500 entry, ₹490 stop, 100 shares, filled ₹490, −₹1,000, −1R, rules followed.
Then spend two minutes on the review. Did the stop fail because the idea was wrong, or because it sat inside normal price noise? Do not judge a trade by its result alone. A stop hit after a sound process is still a good practice trade.
Stop-Loss Practice Example With ₹1,00,000 Virtual Capital
The next two examples use one hypothetical account: ₹1,00,000 virtual capital and ₹1,000 risk per trade. They are not real trades and exclude costs and taxes.
Example 1: Stop-Loss on a Long Trade
| Input | Value |
|---|---|
| Entry | ₹500 |
| Stop trigger | ₹490 |
| Stop distance | ₹10 |
| Quantity | ₹1,000 ÷ ₹10 = 100 shares |
| Target | ₹520 |
| Reward-to-risk | ₹20 ÷ ₹10 = 2:1 |
| Outcome | Exit | P&L | R |
|---|---|---|---|
| Stop fills at trigger | ₹490 | −₹1,000 | −1R |
| Stop fills at ₹488 | ₹488 | −₹1,200 | −1.2R |
| Target hit | ₹520 | +₹2,000 | +2R |
The ₹488 fill is a stress-test assumption, not a measured result. It shows how slippage turns a planned −1R into −1.2R. After costs, the stop-out loses slightly more than that and the target gains slightly less than +2R.
Read the tables as a chain. The stop distance sets the quantity, the quantity sets the loss, and the fill sets the final R. At 2:1 reward-to-risk, one +2R win cancels two −1R losses, so a trader who wins one trade in three would break even before costs. Costs push the real break-even higher. Change one input at a time, such as the stop or the capital, and recompute. That is how the formula becomes familiar.
Example 2: Stop-Loss on a Short Trade
Now reverse the direction. You short 100 shares at ₹500 and place a buy stop at ₹510. The distance is still ₹10, so risk is still ₹1,000. A target at ₹480 would earn ₹2,000, or +2R.
Short trades carry a different danger: price can gap up past your stop, so the loss can exceed the plan. If the stock gapped up to ₹520 at the open, a buy stop would fill near ₹520. The loss would be ₹2,000, or −2R.
Product rules also apply. In Indian cash equities, retail short selling is generally limited to intraday positions. Confirm what your broker and simulator allow.
Which Stop-Loss Strategies Should You Practice?
No single stop method wins in every market. Each answers a different question: how much will I lose, where is my idea wrong, how volatile is this stock, and how long should I wait? Practice each on the same chart, then compare journal results instead of assuming one is best. Use one method for a block of trades before you switch, so the comparison stays fair.
Compare Fixed-Percentage, Structure-Based, ATR and Time Stops
| Method | How you set it | Useful when | Limitation |
|---|---|---|---|
| Fixed percentage | A set percent below entry, such as 2% | You want one simple rule | Ignores chart levels and volatility |
| Structure-based | Just beyond support or a swing low | The chart has clear levels | The level may be far away, forcing a smaller size |
| ATR | Entry minus a multiple of Average True Range (ATR), the typical price range per bar | Volatility changes between stocks | The multiple is a judgment call |
| Time | Exit if the trade has not moved within a set number of bars | You expect a quick move | May exit a trade that would have worked later |
For example, if ATR is ₹6 and you use 1.5 times ATR, the stop sits ₹9 from entry. The multiple here is illustrative. You can also combine methods, such as a structure-based stop checked against ATR to see whether it leaves enough room.
Practice a Trailing Stop and Break-Even Adjustment
A trailing stop follows price in your favor. Write the rules first. Using the ₹500 entry and ₹490 stop, you might move the stop to ₹500 once price reaches ₹510 (+1R). After that, you trail it below each new swing low.
If your simulator lacks trailing orders, adjust manually and log the time and reason for each change. Never lower a long-trade stop. A break-even stop still costs you fees when hit, and tight trails can exit on normal pullbacks.
How Do You Measure Stop-Loss Practice Results?
Judge stop-loss practice by discipline, not profit. A good practice trade has risk defined before entry, a stop that was placed and not moved, a calculated size and a recorded result. Profit over a few virtual trades says little. Track whether losses match planned risk and whether you follow your rules consistently.
Build a Trading Journal Using R-Multiples
R is your planned risk on one trade. In this guide, 1R = ₹1,000. Rupee results hide differences in risk: winning ₹500 on a ₹250 risk is better than winning ₹500 on a ₹2,000 risk. R puts every trade on one scale.
Realized R = Net P&L ÷ Planned risk
Example: −₹1,200 ÷ ₹1,000 = −1.2R.
| Field | What to record | Hypothetical example |
|---|---|---|
| Setup | Symbol, timeframe, direction, reason | Long, daily chart, support hold |
| Order | Type, entry, stop, quantity | Stop-market, ₹500, ₹490, 100 |
| Planned risk | Rupees and R | ₹1,000 = 1R |
| Execution | Trigger time, fill, costs | Filled ₹488, costs excluded |
| Result | Net P&L and realized R | −₹1,200, −1.2R |
| Behavior | Rules followed? Stop moved? | Yes; no |
| Evidence | Dated screenshot of the order ticket and fill | Link to saved image |
Keep units consistent: rupees per share for prices, rupees for profit and loss. Add a note whenever costs are excluded.
Neostox's trading reports show simulated profit and loss, win rate, margin use and costs. Read them next to your own notes. A report cannot tell you whether you followed your rules or moved a stop.
Review Stop-Loss Accuracy and Trading Metrics
Review these five measures after each batch of trades:
- Rule adherence: share of trades that followed your plan
- Average slippage: fill price minus stop price
- Average loss in R: close to −1R means stops work as planned
- Win rate and average win in R
- Expectancy: (win rate × average win) − (loss rate × average loss)
For instance, 4 wins of +2R and 6 losses of −1R give (0.4 × 2) − (0.6 × 1) = +0.2R. That is an illustration. A small sample proves little, so review in batches that used the same rules.
How Do You Stress-Test a Stop-Loss Strategy?
Rerun the same trade under worse conditions: a faster move, a wider fill, an overnight gap and a stop-limit that fails to fill. Compare planned loss with the loss you would have taken. Label each scenario as an assumption, not a measurement.
Test Slippage, Gaps and Unfilled Stop-Limit Orders
Assume a stop trigger of ₹490, a stop-limit price of ₹488, 100 shares and a ₹500 entry. All scenarios are hypothetical.
| Scenario | Stop-market | Stop-limit |
|---|---|---|
| Orderly move through ₹490 | Fills near ₹490, about −1R | Fills at ₹488 or better, −1R to −1.2R |
| Fast drop to ₹487 | Fills near ₹487, −1.3R | May not fill; position stays open |
| Gap open at ₹480 | Fills near ₹480, −2R | Not filled; loss keeps growing |
The SEC's guide to order types explains that a stop order's trigger price is not its execution price, and that a stop-limit order may not execute. Exchange price limits on a stock can also restrict exits, so check the rules for your market. Model any scenario your simulator cannot reproduce in a spreadsheet.
Avoid Common Paper-Trading Stop-Loss Mistakes
| Mistake | Impact | Fix |
|---|---|---|
| Widening the stop after entry | Loss exceeds the plan | Move a stop only to reduce risk |
| Stop inside normal noise | Repeated small losses | Use structure or ATR |
| Guessing the quantity | Uneven risk per trade | Use the sizing formula |
| Ignoring costs | Overstated results | Deduct estimated charges |
| Overtrading | Weak review quality | Cap trades per day |
| Placing the stop after entry | The trade is unprotected while you hesitate | Enter and protect in one step |
| Treating a winning streak as proof | False confidence | Judge process over a larger sample |
When Are You Ready to Move Beyond Paper Trading?
There is no trade count that proves readiness. You are closer when you follow your rules consistently in different market conditions. Your journal should include realistic costs and slippage. You should also understand how live fills differ from simulated ones. Even then, paper results do not predict live results.
Check yourself against this list:
- Your stops matched your plan on nearly every trade.
- You have tested gap and no-fill scenarios.
- Your losses stayed near planned risk.
- Your journal is complete enough to review.
- You can take a full −1R loss without moving the stop.
If you go live, consider starting smaller than your paper size. Real money changes behavior in ways a simulator cannot show. If a simulated loss still tempts you to move a stop, you have more practice to do.
Final Checklist and Conclusion
Before each trade, confirm:
- The stop sits where your idea fails.
- Quantity comes from the formula.
- The stop is placed with the entry.
- You will record trigger time and fill price.
- You will journal the trade the same day.
The gap between planned and simulated loss is the most useful number you will collect. It shows how much your results depend on execution assumptions. To run the loop with virtual money, start with Neostox.
This article is for education only and is not investment advice. Neostox profits are virtual and cannot be withdrawn. Simulated results do not indicate how live trading will perform, and trading involves risk of loss. Stop orders do not guarantee an execution price.