
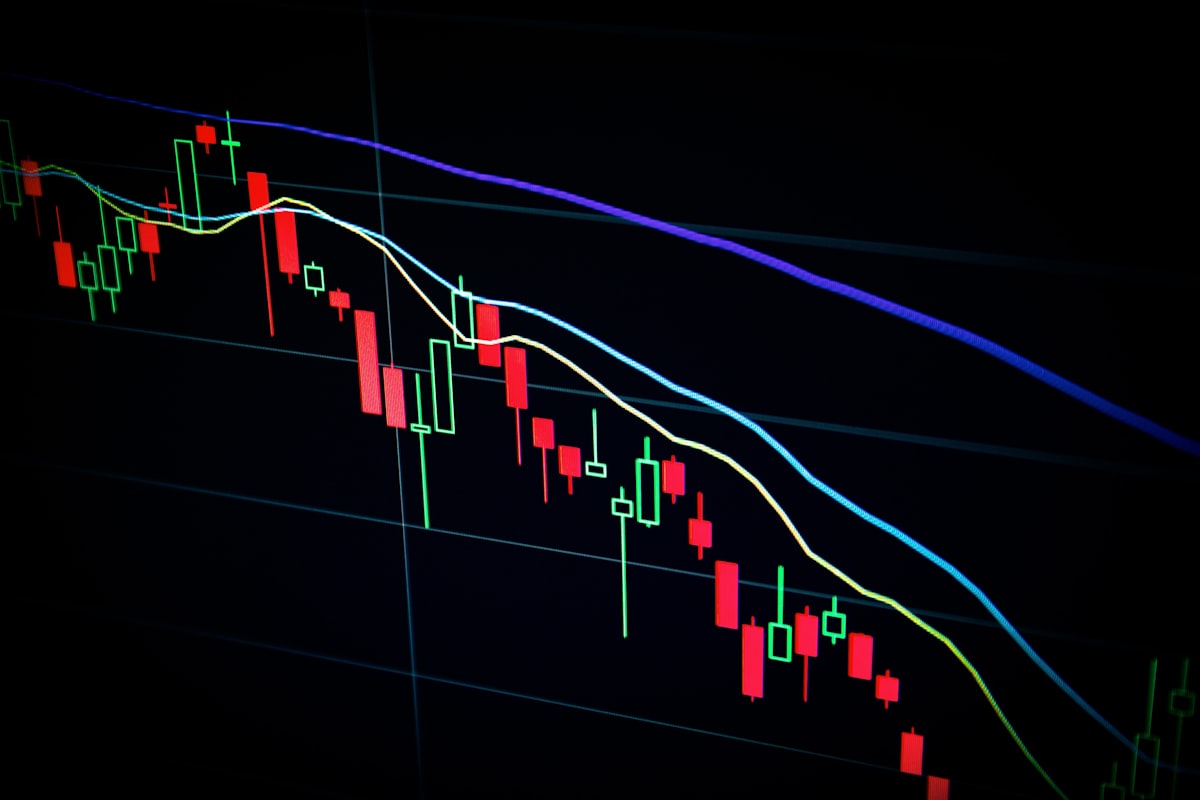
Your practice account started at ₹1,00,000. It reached ₹1,10,000, then slipped to ₹99,000. You might look at the starting balance and think, “I'm only down ₹1,000.”
That's true, but you've also lost ₹11,000 from the highest point the account reached. Which number should you be looking at?
They tell you different things. Trading drawdown measures the fall from an earlier account high. It helps you see how much ground you've given back, even when you're still close to the amount you started with.
We'll follow this made-up account through a further fall and a recovery. Keep a calculator nearby; the percentages are easier to understand once you see what amount each one is using.
Which starting point are you using?
A loss can describe one trade. Drawdown describes an account's decline relative to a previous high. You can have several small losing trades that combine into a larger drawdown. You can also remain in drawdown after a profitable day if the account is still below its earlier peak.
Suppose an account starts at ₹1,00,000, rises to ₹1,10,000 and then falls to ₹99,000. It’s 1% below where it started, but 10% below its high. Neither number is wrong. They use different starting points.
Drawdown depth and recovery add context that a return number alone can’t provide. When testing a strategy in a simulator, record the account's path as well as its final result. Two tests can finish at the same value after experiencing very different declines along the way.
Use this formula: drawdown percentage = (previous peak equity − current equity) ÷ previous peak equity × 100. Here, we’ll write the size of the fall as a positive percentage. Some software displays the same figure with a minus sign.
In the example, the previous peak is ₹1,10,000 and current equity is ₹99,000. The decline is ₹11,000. Dividing ₹11,000 by ₹1,10,000 gives 0.10, or 10%.
Keep updating the peak when the account makes a new high. If equity later rises to ₹1,15,000, that becomes the reference for the next decline. A starting deposit isn’t the permanent peak against which every future drawdown should be measured.
Follow the account down to ₹88,000
Maximum drawdown is the largest peak-to-trough percentage decline within the period being reviewed. The low has to come after the high. You can’t simply subtract the lowest account value from the highest if the low came first.
Imagine this sequence of account equity: ₹1,00,000, ₹1,10,000, ₹99,000, ₹1,08,000, ₹88,000 and ₹1,12,000. The largest decline is from ₹1,10,000 to ₹88,000. That’s ₹22,000, or 20% of the earlier peak.
The eventual rise to ₹1,12,000 doesn’t erase that historical drawdown. It only means that the account later recovered and reached a new peak. Historical maximum drawdown remains part of the period's record.
Why the recovery percentage is bigger
A percentage loss is measured from the higher amount. A percentage recovery is measured from the lower amount left after the loss. You’re working out the gain on the smaller amount left in the account.
Start with ₹1,00,000 and lose 20%, leaving ₹80,000. A 20% gain on ₹80,000 adds ₹16,000 and brings the account to ₹96,000. You still need ₹4,000 to recover fully.
The required recovery is ₹20,000 divided by ₹80,000, which equals 25%. More generally, recovery percentage = drawdown percentage ÷ (100 − drawdown percentage) × 100. A 10% decline needs about 11.11%; a 50% decline needs 100%.
These are arithmetic relationships, not recovery forecasts. Nothing in the calculation tells you whether the account will recover, how long it will take or how much risk would be involved.
What if a losing position is still open?
A balance based only on closed trades leaves out what’s happening to positions you still hold. Account equity includes the current value of those open positions. If an open position is losing heavily, a balance-only record may hide a decline you’re already exposed to.
Write down which number you’re tracking. For example, write 'end-of-day equity drawdown including open positions' rather than simply 'drawdown'. Use the same definition across the whole record.
How often you record it matters too. A record captured only at the end of each day can miss a deeper intraday decline. A weekly record can miss even more. Comparisons are more useful when their observation frequency and equity definitions match.
Suppose an account falls from ₹1,00,000 to ₹80,000 and you add ₹20,000. The displayed amount returns to ₹1,00,000, but the trading loss has not been earned back. It has been replaced with new capital.
The same issue arises when you reset a simulator or top up virtual money. Record those changes separately. For a straightforward practice exercise, use a period without cash additions so the calculation stays easy to interpret.
If you add or take out money, the balance alone won’t tell you how the trades performed. Track those cash changes separately, or split the review into periods without them. Otherwise, a withdrawal can look like a trading loss and a deposit can look like performance.
Look back at the trades behind the fall
Recovery time is another useful observation. Mark when the previous peak occurred and when equity first exceeded it again. An account can recover its value while spending a long period below the peak. If the review ends before recovery, record the period as still unrecovered rather than assigning an imagined end date.
Keep the measurement period beside every figure. A maximum drawn from one month and one drawn from several years don’t describe equally long exposure to changing conditions.
Look at the trades that caused the decline. Did you increase quantity after losing? Were several positions exposed to the same sector move? Did open losses grow while your closed-trade results looked acceptable?
Neostox's guide to swing-trading risk management covers related decisions about position size and overnight exposure. Drawdown turns the combined effect of those decisions into an account-level measurement.
Build review rules before the next practice period. Neostox's five trading rules offer broader context on protecting capital, defining risk and reviewing results. Use that framework to write your own exposure and loss rules. No single percentage is suitable for every strategy or person.
You can use Neostox's performance reports alongside your own dated equity log. Its website currently states that market prices are delayed by 30 days. Simulated results are a learning record, not evidence of achievable real-money returns.
Now look again at that ₹99,000 account. You can say it's ₹1,000 below where you started and ₹11,000 below its earlier high. You know why both statements are true, and you know which one describes drawdown.
Keep the peak and the date beside your next account entry. If you add virtual money, record that separately. Then, when the balance improves, you'll be able to tell whether your trades recovered the loss or whether you simply topped the account up.