
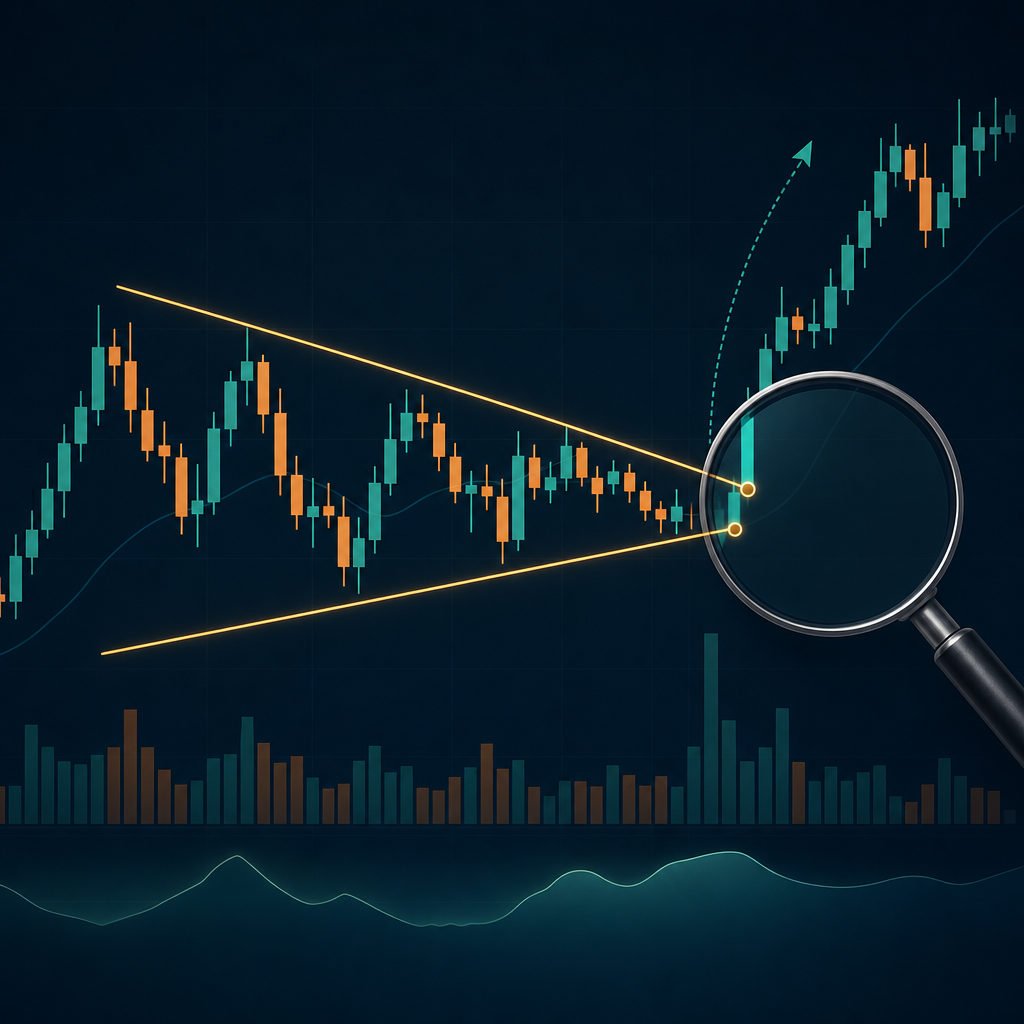
Why triangle patterns are difficult to draw consistently
Triangle patterns look simple in textbooks: draw two converging trendlines, wait for price to break one of them and plan a trade. On a live chart, the process is rarely that clean.
The first challenge is identifying meaningful swing points. Different traders can look at the same chart and connect different highs and lows. Long wicks make the boundaries even more subjective, while changing the timeframe can alter the entire formation.
This is a major pain area for beginners and intermediate traders. A trader may spend several minutes adjusting one triangle without knowing whether the selected points are valid. Repeating that exercise across dozens or hundreds of stocks becomes exhausting and impractical. By the time the scan is complete, some breakouts may already have occurred.
The solution is not to pretend that triangle drawing is perfectly objective. Instead, traders need a consistent method, clear confirmation rules and a faster way to scan multiple charts.
Should triangle trendlines use wicks or candle bodies?
Many traders draw trendlines through absolute candle highs and lows. An alternative is to focus on candle bodies by using opening and closing prices. The body shows the range within which price opened and settled during that candle, while the wick records prices that were visited but not sustained.
For a body-based triangle, use the higher edge of each candle body to identify upper swing points and the lower edge to identify lower swing points. In practical terms, the upper body edge is the higher of the open and close, while the lower edge is the lower of the two.
This approach can produce cleaner boundaries because isolated spikes are less likely to distort the trendlines. It is particularly useful when several candles briefly cross a level but repeatedly close back inside the structure.
However, it would be a mistake to say that wicks have no value. A wick can reveal rejection, a liquidity sweep, failed acceptance beyond a level or intraday volatility. The better principle is to give candle bodies more weight when defining the main structure while using wicks as additional information about price behaviour.
A practical rule for drawing body-based triangles
- Choose one timeframe and do not switch timeframes merely to make the pattern look better.
- Mark the upper edges of the candle bodies at visible reaction points.
- Mark the lower edges of the candle bodies at visible reaction points.
- Connect at least two meaningful points on each side, preferably with additional touches or reactions.
- Check that the two boundaries are converging rather than remaining parallel.
- Allow occasional wicks beyond the lines, but be cautious if multiple candle bodies close outside the structure.
- Wait for a candle close beyond the relevant boundary before treating the move as a breakout candidate.
Consistency matters more than forcing every candle to fit perfectly. If the lines need constant adjustment or cut through several candle bodies, the pattern may not be reliable enough to trade.
The three main types of triangle formations
Ascending triangle
An ascending triangle generally has a relatively flat upper boundary and a rising lower boundary. Buyers appear willing to enter at progressively higher levels while price repeatedly tests resistance.
It is often described as bullish, but the label is not a guarantee. A close above resistance can create a long setup, while a decisive break below the rising support invalidates the bullish interpretation.
Descending triangle
A descending triangle has a relatively flat lower boundary and a falling upper boundary. Sellers are entering at lower levels while price repeatedly tests support.
The pattern has a bearish bias, but traders should still wait for confirmation. A strong close above the falling boundary can invalidate the expected downside break.
Symmetrical triangle
A symmetrical triangle contains a falling upper boundary and a rising lower boundary. Price compresses as the range narrows, but the pattern itself does not reliably predict direction.
Continuation in the direction of the earlier trend is possible, but traders should avoid assuming the outcome. The breakout direction, closing strength, market context and follow-through matter more than the pattern's name.
How volume behaves inside a triangle
Volume often contracts as a triangle develops because the trading range is narrowing and both sides are waiting for a clearer move. A breakout accompanied by expanding volume can indicate stronger participation, but volume should not be reduced to a single rule.
- High volume with a strong price move: This can show broad participation and improve the credibility of the breakout.
- High volume with little price progress: Heavy activity without movement may indicate absorption or a struggle between buyers and sellers. It is not automatically bullish or bearish.
- Low volume with a large price move: Price can jump when liquidity is thin or when there are few orders on the other side. Such a move may continue, but it can also reverse quickly.
- Large wick with high volume: Price traded beyond a level but failed to remain there. This can signal rejection, profit-taking or opposing orders absorbing the move.
Volume must therefore be read alongside the candle close and subsequent price action. A large volume bar does not confirm a breakout if the candle closes back inside the triangle.
A stronger breakout checklist
- The breakout candle closes outside the body-based boundary.
- The candle has a reasonably strong body rather than only a long wick beyond the line.
- Volume expands relative to recent bars, or the next candles show clear follow-through.
- The breakout agrees with nearby support, resistance and the broader market structure.
- Price does not immediately close back inside the triangle.
- The trade offers acceptable reward relative to the invalidation level.
No single item guarantees success. The checklist helps filter weak setups rather than predict every breakout correctly.
Why manual triangle scanning becomes impractical
Finding one triangle manually is manageable. Scanning an entire watchlist is not. For every chart, the trader must identify swings, compare bodies with wicks, draw converging boundaries, inspect volume and then monitor the possible breakout.
This workload creates two problems. First, it limits the number of instruments that can be reviewed. Second, fatigue encourages inconsistent decisions: a trader may accept a weak pattern simply because considerable time has already been spent searching.
Automated detection does not remove the need for judgement, but it can narrow a large market into a practical list of charts for manual review.
Using Neostox to scan triangle patterns
Neostox provides pattern identification on running charts together with volume analysis. Instead of manually opening and drawing trendlines on every stock, traders can use the platform to locate potential triangle formations and breakout candidates more efficiently.
The practical workflow is straightforward:
- Use Neostox to scan for triangle formations on the chosen timeframe.
- Open each shortlisted chart and check whether the body-based boundaries make structural sense.
- Review how volume behaved during compression and at the breakout.
- Confirm that the candle closed outside the pattern rather than merely creating a wick.
- Define the entry condition, invalidation level and position size before acting.
- Paper trade the rule set first if its performance is not yet understood.
The scanner should be treated as a time-saving filter, not as an automatic buy or sell signal. Its main advantage is reducing the exhausting task of manually searching a large number of charts while a setup is developing.
Planning a triangle breakout trade
A common entry is above the high of a confirmed bullish breakout candle or below the low of a confirmed bearish breakout candle. More conservative traders may wait for price to retest the broken boundary, although a retest does not always occur.
The invalidation level should reflect the trade idea. Depending on the setup, it may sit beyond the breakout candle, beyond the broken trendline or behind the latest internal swing. A wider stop requires a smaller position size to keep risk controlled.
A traditional target estimates the widest part of the triangle and projects that distance from the breakout area. This is only a planning reference. Nearby support, resistance, gaps and changing volume may justify taking partial profits or exiting earlier.
Common mistakes to avoid
- Forcing a pattern: Not every period of consolidation is a triangle.
- Using arbitrary swing points: Select visible reactions rather than minor fluctuations that only make the lines fit.
- Treating every wick as meaningless: Wicks can contain useful information about rejection and failed acceptance.
- Entering before the close: An intraday move beyond the line can become a false breakout by the end of the candle.
- Relying on volume alone: High volume without price progress may show absorption rather than confirmation.
- Ignoring market context: A stock breakout can fail if the broader index or sector is moving strongly in the opposite direction.
- Scanning without a fixed method: Changing the definition from chart to chart produces inconsistent results.
The practical takeaway
Triangle patterns are useful because they organise compression, swing structure and breakout levels into a clear visual framework. Their weakness is subjectivity, especially when traders rely on every wick and manually search a large universe of stocks.
Using candle bodies can make the boundaries more consistent, but wicks should still be read as evidence of rejection or volatility. Combine the structure with closing confirmation, contextual volume and disciplined risk management.
For traders struggling with the time and difficulty involved in manual scanning, Neostox offers a practical route to identify triangle patterns and review breakout volume on running charts. Use the scan to create a shortlist, then validate each setup rather than trading the pattern label blindly.