
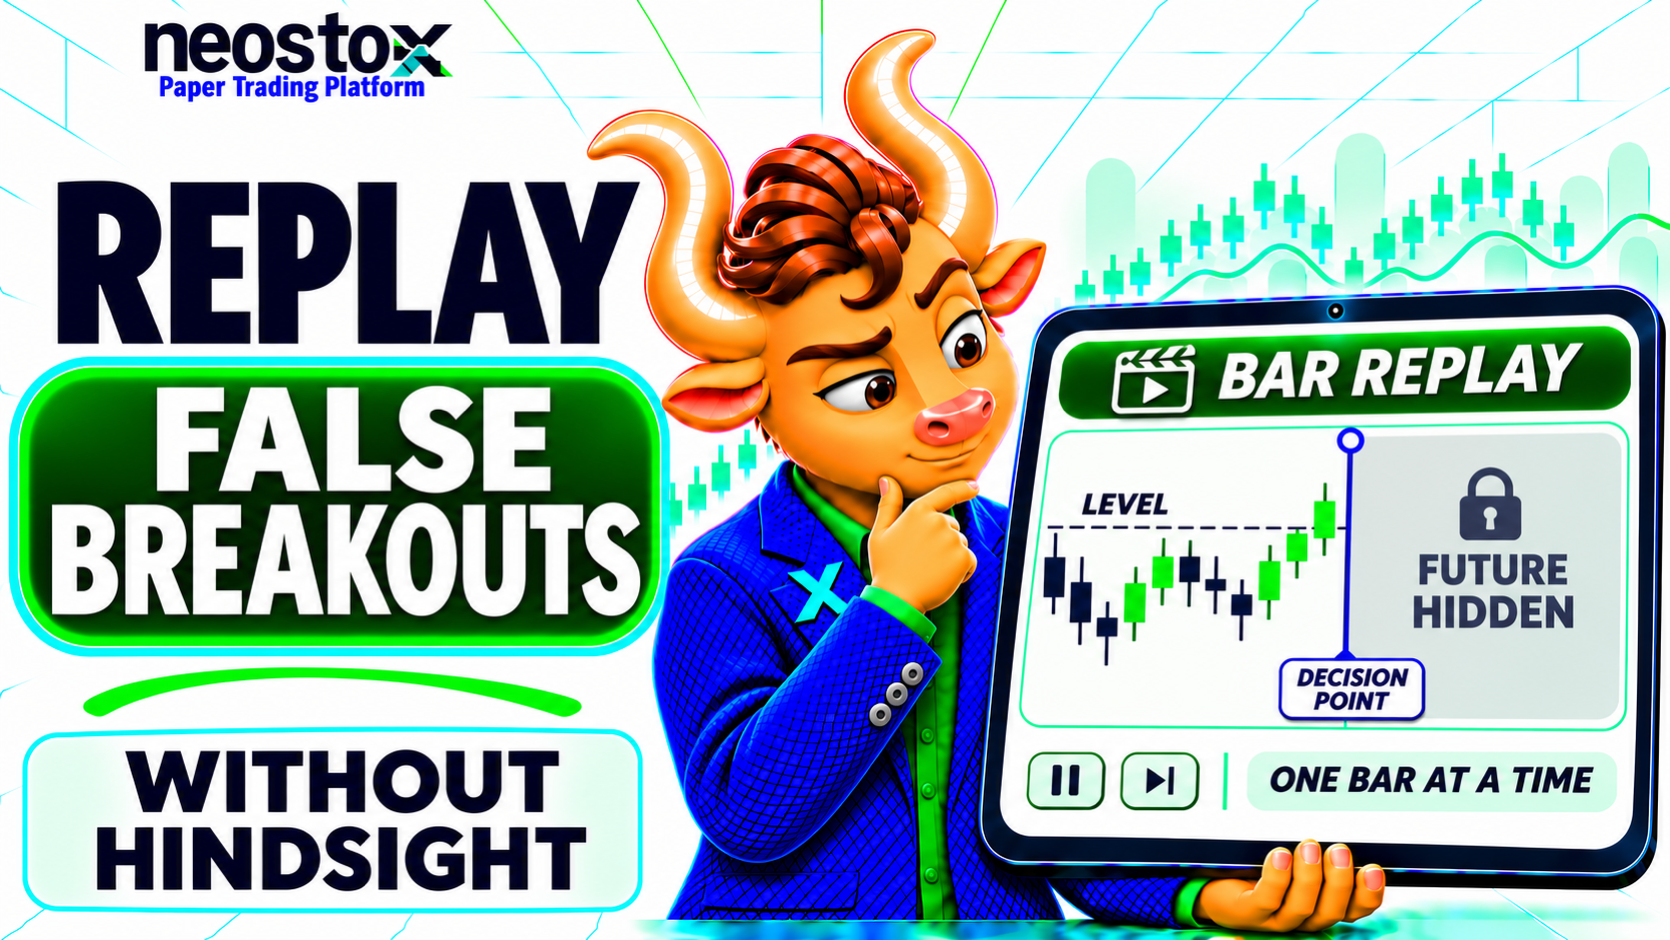
Every price below is an invented price unit, chosen for teaching. None of it is exchange data, a trade signal or advice, and the examples show a method of practising, not a setup that works.
What Is a False Breakout?
A false breakout is a move beyond a previously identified price level that does not sustain and returns toward or inside the prior structure. The word "false" is a label you apply afterwards, with hindsight. At the moment of the break, nobody knows which kind it is, which is why this guide asks you to decide first and label second.
Failed Break vs Retest
A break beyond a level can develop in three distinct ways, and the drills train you to tell them apart:
| State | What price does | What you may call it |
|---|---|---|
| Wick-only breach | Trades beyond the level during a candle but closes back on the original side | A breach with no closing breakout |
| Close, then re-entry | Closes beyond the level, then the next candle closes back inside the range | A failed-break candidate |
| Close, then retest | Closes beyond the level, then returns to test it from the other side | A hold, a failure or an inconclusive retest |
"Fakeout" and "false breakout" mean the same thing here. Not every pullback is a fakeout, and a retest that holds is a different lesson from a retest that fails. Treat every label as a practice classification, not a prediction.
How Do You Set Up a Hindsight-Free Replay?
Pick an unfamiliar stretch of history, hide everything after your pause point, mark the level before you reveal anything, write your rules, and step forward one candle at a time. Any chart tool that can hide future candles and advance one bar at a time will do. Controls and plan limits differ between tools and change, so check yours yourself.
Choose the Data
Choose a historical segment you have not studied. Write down the instrument, timeframe, session date, time zone and where the bar data came from. If the tool shows only candles, remember that a candle is a summary: it does not tell you the order in which its high and low occurred. If you use indicators, check that they do not use information from candles that are still hidden.
Lock the Level and Rules
Follow these six steps in order:
- Choose the segment and record instrument, timeframe, date and time zone.
- Hide all future candles and start the replay a few bars before the level is tested.
- Mark the support or resistance level and write down its price before you advance.
- Write your rule: what counts as a break, what you will do (enter, wait or skip) and where the idea is invalidated.
- Advance one candle at a time. At the decision bar, log your choice before you reveal the next candle.
- Reveal, classify the result, score the five checks and leave your first decision unedited.
Which Signs Need Checking?
No single sign proves a break is real or false. Decide in advance which signs your rule uses, and write them down.
| Sign | What it can show | Limitation |
|---|---|---|
| Wick | Price traded beyond the level during the candle | Says nothing about whether the move was accepted |
| Close | Where the candle ended relative to the level | One close can reverse on the next candle |
| Volume | Participation, where it is available | Not available or comparable for every instrument; does not prove follow-through |
| Retest | How price behaves when it returns to the level | Easy to label with hindsight; needs a written zone |
Wick Versus Close
A wick beyond a level shows that price traded there. A close beyond it shows that price finished there. Define which one your rule requires.
Volume and Retest
Volume may add context, but test any volume filter with the same written criteria across a varied batch, not on one tidy example. A retest needs a written zone before you reveal the bar, or you will fit the zone to what happened.
Drill 1: Wick Beyond a Level
Aim: learn patience when only the wick has crossed.
Resistance is marked at 250.0, and price has been trading in a range of about 245.0 to 250.0. Your written rule: enter long only after a candle closes above 250.0.
Decision
Pause at the bar in progress. You can see all earlier candles and this candle so far: it opened at 248.9, has a high so far of 250.4, a low so far of 248.5 and is trading at 250.2. It has not closed. Before you read on, write the level, your rule, enter, wait or skip, your reason, and the condition that would change your mind on the next candle.
Cover the next paragraph until you have written your answer.
Reveal
The candle closes at 249.3, with a final high of 250.7 and a low of 248.5. It crossed the level by 0.7 but closed below it. By your rule, no closing break occurred, so waiting was the rule-following choice. Classify it as a wick-only breach, no closing breakout. Call it a wick-only breach when the final high is above 250.0 and the close is at or below 250.0, and a closing break when it closes above 250.0. Do not conclude what happens next, because this one candle does not show whether price will reject the level or break it later.
Drill 2: Close Outside, Then Re-entry
Aim: learn how to respond when a confirmed break fails quickly.
Same level, 250.0. This drill uses the first two candles of the six-candle example below, but look at only one at a time. Your rule: enter long only after a candle closes above 250.0, with a stop 1.2 below the entry.
Decision
The pause bar has just closed. It opened at 248.2, reached a high of 251.6, a low of 247.8 and closed at 251.0. The earlier candle closed at 248.2, inside the range. The rule is met. Write down: enter, wait or skip; your reason; and the stop.
Invalidation
Write two invalidation conditions before advancing: a price (the stop at 249.8, which is 1.2 below the assumed entry of 251.0) and a structure (a candle closing back at or below 250.0). Then advance exactly one candle: it opens at 251.0, reaches a high of 251.3, a low of 249.1 and closes at 249.6. The close is back inside the range, so log a failed-break candidate and keep observing before making categorical claims. Your condition is written in advance: the next candle closing at or below 250.0 makes it a failed-break candidate, a close above 250.0 keeps the break alive, and a missing or unclear close is inconclusive. Do not rewrite your decision on the first candle. Entering followed the rule, whatever happened next.
Drill 3: Retest or Failure?
Aim: avoid labelling every pullback as a trap.
Level 250.0. A candle opened at 249.6, reached a high of 251.8, a low of 249.4 and closed at 251.4. Price has now closed beyond the level and is coming back to test it. At this pause, everything up to and including that candle is visible, and nothing after it.
Zone
Before revealing the next candle, write the acceptable retest zone: 249.8 to 250.6. Then write the rules. Hold: the low stays at or above 249.8 and the candle closes above 250.0. Failure: the candle closes at or below 250.0. Inconclusive: anything else.
Hold or Break
Compare three invented retest candles against those rules:
| Retest candle | Low | Close | Label |
|---|---|---|---|
| Orderly | 250.2 | 251.1 | Hold (inside the zone, closes above) |
| Close back into the range | 249.1 | 249.6 | Failure |
| Volatile, ambiguous | 249.5 | 250.1 | Inconclusive (broke the zone floor, still closed above) |
The orderly retest is a continuation case, not a trap. The ambiguous candle shows why you write the rules first: without them you would call it whatever fits your mood.
Worked Example: A Six-Candle Failed Upside Breakout
All prices are invented. Before the replay, the observed range is about 245.0 to 250.0, and resistance is 250.0. Your provisional rule: consider a long entry only after a close above 250.0, with the stop set before the next candle.
Table
| Bar | Open | High | Low | Close | What you may know only after this bar |
|---|---|---|---|---|---|
| 0, setup | 247.0 | 248.6 | 246.2 | 248.2 | Inside the range. Mark 250.0 before advancing |
| 1, breakout | 248.2 | 251.6 | 247.8 | 251.0 | Closes outside 250.0. Pause and log enter, wait or skip |
| 2, re-entry | 251.0 | 251.3 | 249.1 | 249.6 | Closes back inside: failure candidate |
| 3, follow-through | 249.6 | 250.0 | 248.4 | 248.9 | High touches 250.0 but does not exceed it; stays inside |
| 4, downside | 248.9 | 249.3 | 247.6 | 247.9 | Lower again in this invented sequence |
| 5, uncertain | 247.9 | 248.9 | 247.5 | 248.5 | Still inside; the picture is clearer in hindsight than it was |
Walk-Through
At bar 1 the rule is met, so entering was consistent with it. Assume an entry at 251.0, the close of bar 1, and a stop at 249.8. The risk is 1.2 price units, which is 1R. Bar 2's low of 249.1 reaches the stop, and its close of 249.6 is back inside the range. Bars 3 to 5 stay inside. Bar 3's high equals the level but does not exceed it, so a rule that needs a close above 250.0 would not have re-triggered. Never go back and change the bar 1 decision because of bars 2 to 5. The next section explains the result in R. Keep a clean continuation example, like Drill 3, and a no-setup session in every batch, so your sample is not made only of traps.
Define Risk and Replay Fill Assumptions
A result means little until you state what you assumed about the fill.
R
R is your planned risk on one trade. A long entry at 251.0 with a stop at 249.8 has a risk of 1.2, so a loss at the stop is −1.0R, before costs. Define R before the reveal, not after.
Execution
If the stop fills at exactly 249.8, the result is (249.8 − 251.0) ÷ 1.2 = −1.0R. If a fast market fills it at 249.4, it is (249.4 − 251.0) ÷ 1.2 = −1.33R. A candle shows high, low and close, but not the order they occurred in, so it cannot prove that the stop filled, or at what price. Record both an assumed fill and a worse fill, and add the spread, slippage and charges you assume. The bid, ask and LTP guide and the guide to stop-loss market and stop-loss limit orders explain why a quoted level is not a guaranteed fill.
Track and Score Every Attempt
Record each attempt the same way, so that you can compare attempts later. A copy-ready journal is in the practice worksheet.
Journal
| Field | What to write |
|---|---|
| Session | Session ID, instrument, timeframe, data source |
| Level | The price and zone, marked before the replay |
| Pause point | Bar index or time; whether future bars were hidden |
| Rule and decision | Enter, wait or skip; the written rule; the time you logged it |
| Risk | Entry assumption, stop, 1R, fill assumption |
| Reveal | Wick or close beyond the level; re-entry; retest; volume if available |
| Outcome label | Continuation, failed-break candidate, inconclusive or no setup |
| Review | Rule followed, no lookahead, what surprised you |
A filled example from this guide:
| Attempt | Decision | Outcome label | Assumed result | Process score |
|---|---|---|---|---|
| Drill 1 | Wait | Wick-only breach | No trade | 5 of 5 |
| Drill 2 | Enter | Failed-break candidate | −1.0R before costs | 5 of 5 |
| Drill 3 | Enter after the hold | Continuation (hold) | Open: no exit in the sample | 5 of 5 |
Rubric
Give one point for each of five checks: the level was marked before the reveal, future candles stayed hidden until the decision was logged, the recorded choice matched your rule, the risk and a conservative fill assumption were logged, and you classified the result without rewriting your first decision. For a wait or skip, count "risk defined" if you wrote what would have invalidated the idea. A score of 5 of 5 measures process compliance. It is not a probability that a trade is profitable. Also track your skip rate, rule breaches and ambiguous cases. For help with the journal habit, see what to write down on your first paper trade.
Common Mistakes
Replay is easy to practise badly, and a bad habit repeated twenty times still looks like twenty sessions.
Hindsight
Moving a level, a stop or a rule after seeing the candles that follow makes every attempt look right. Mark and write first, and treat a rule you change mid-session as a new attempt.
Overfitting
Tuning a rule until it fits five charts tells you about those five charts. Freeze the rule for a whole batch before judging it.
| Mistake | Correction |
|---|---|
| Choosing only dramatic fakeouts | Select segments by a date rule, and include clean breakouts and no-setup sessions |
| Using indicators that peek at future candles | Check how each indicator is calculated in replay |
| Judging by the close only | Record the intrabar path you can see, and your worst assumed drawdown |
| Pooling every result into one success rate | Split results by timeframe and instrument |
A 20-Session Practice Plan
Twenty varied sessions are a sensible first learning batch, not proof of an edge. More diverse sessions would be needed before drawing any statistical conclusion.
Sample Mix
- Sessions 1 to 5: range days; focus on Drill 1, wick versus close.
- Sessions 6 to 10: trend days and clean breakouts; focus on Drill 2.
- Sessions 11 to 15: high-volatility sessions and retests; focus on Drill 3.
- Sessions 16 to 20: a mixed batch, including sessions with no qualified setup, where "skip" is the correct answer.
Review
After every five sessions, count your skip rate, rule breaches and ambiguous cases, and compare your first classification with the later outcome. Read the journal rather than only the totals. Split by timeframe and instrument, and do not average them together.