
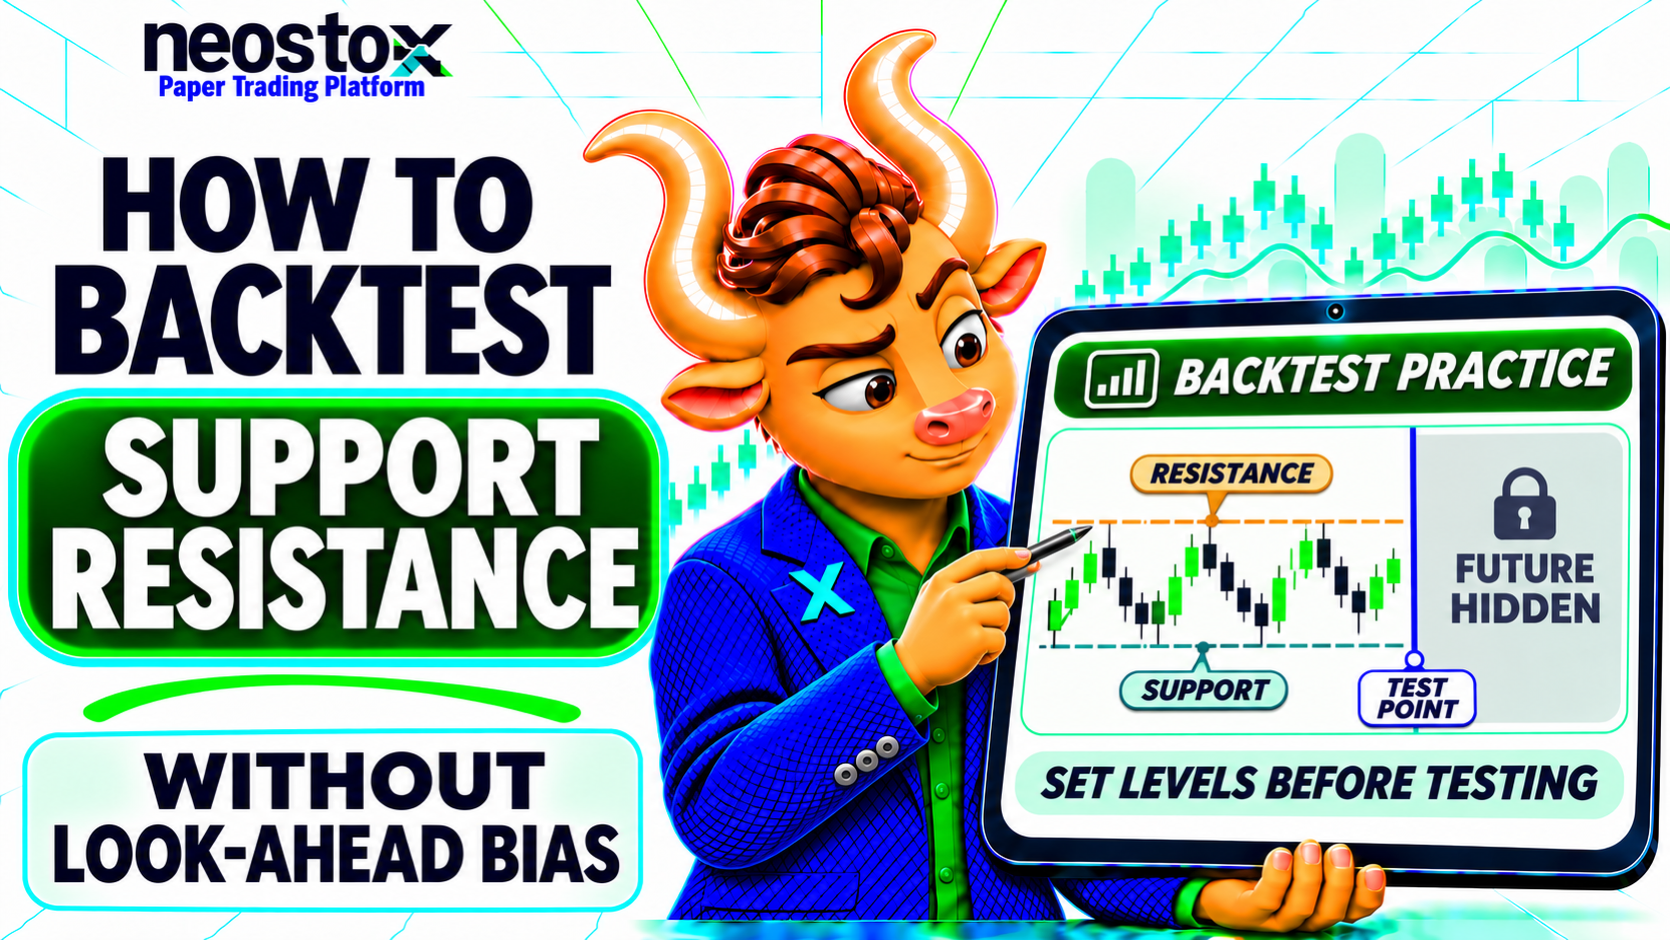
Three warnings before you start:
- A signal that needs a candle's final close cannot be filled at that same close.
- A profit before costs can disappear once spread, slippage and fees are added.
- A rule tuned on one sample can fail on the next.
In the first worked example below, one invented rule shows +₹3 per unit with a same-close fill and −₹3 with a next-open fill. Every price, date and result in this guide is invented for teaching. None of it is market history, a trade signal or advice.
What Is Bias-Free Backtesting?
Bias-free backtesting is a process for judging whether a historical result was achievable, not a promise of profit. The label is a goal, not a certificate: it reduces known flaws, but it cannot remove data errors, model uncertainty or a change in market conditions.
The process runs in one chain: the information must exist, then the signal can be generated, then the order can be placed, then the fill can happen. If any link is out of order in your test, the result describes trades you could not have made. That is why this guide starts with timing, before indicators, parameters or metrics.
What It Can and Cannot Prove
A careful backtest can show that a rule would have been tradable under your stated assumptions, and where it is fragile. It cannot show that the rule will work next month, or that a good result came from skill rather than from the sample. A strategy that looks good on past data is a hypothesis to keep testing, first on data it has not seen and then in forward paper trading.
Which Backtesting Biases Matter Most?
Five problems account for most misleading results. Four are about data and statistics, and one is about the order and cost model. Keep them apart, because the fixes differ.
| Problem | How it happens | Symptom | Remedy |
|---|---|---|---|
| Look-ahead bias and repainting | The test uses information that was not yet available at the decision time | Entries at prices nobody could trade; unusually smooth results | Stamp every input with its release time and delay the fill until after the signal |
| Survivorship bias | The test universe leaves out companies or instruments that were delisted, merged or removed | Results look better than a real portfolio would have been | Use the universe as it stood on each historical date |
| Data snooping and overfitting | Many rules or parameters are tried until one fits the past | A rule that only works at one exact setting | Fix rules before testing; test on unseen data |
| Selection bias | Only favourable dates, instruments or setups are chosen | Great results on hand-picked periods | Choose samples by a rule set in advance; include bad periods |
| Execution-model omissions | Spread, slippage, fees and partial fills are ignored | A gross profit that is not a net profit | Model costs per completed trade and stress them |
Look-Ahead and Repainting
Look-ahead bias is the use of future information in an earlier decision, such as a candle's final close before it has closed. Repainting is a different problem, in which an indicator changes its past values after the fact. They can overlap, but they are not the same. Using a completed candle's close is fine if the trade is placed after that candle closes.
Survivorship, Snooping and Selection
If you test only on companies that still exist, you have removed the failures. If you try fifty parameter settings and report the best one, you have measured the luck of that search. If you pick only the months where the idea looked good, the result describes your choice, not the rule.
Execution Omissions
Omitting costs is a modelling error, not a data error. A perfectly timed signal can still lose money net of costs, as the cost example below shows.
How Do You Build an As-of Historical Dataset?
An as-of dataset records not only what a value was, but when it became known. Every input should carry the date and time it was published or observable, and the test may use it only from that moment.
Point-in-time data, in plain language, means data as it was available on a given date, not as it was later corrected or restated.
Report-Release Timestamps
A company's results for a quarter are published some time after the quarter ends. Suppose a quarter ends on 31 March and the result is published on 14 May. A test that rebalances on 15 April cannot use that result, even though it belongs to the quarter that has already ended. Stamp the value with 14 May, not with 31 March.
Historical Index Membership
If your rule picks stocks from an index, use the list as it stood on each rebalance date. Using today's constituents quietly adds companies that were not in the index then, and removes the ones that dropped out.
Corporate Actions and Delistings
Splits, bonus issues and similar events change quoted prices without changing value, so history needs consistent adjustment. Delisted instruments need an explicit treatment, such as the last available price, rather than silent removal. Write the treatment in a data dictionary, with the source of the data.
How Do You Freeze Rules and Signal-to-Fill Timing?
Write the full rule before you look at any results: entry, exit, stops, position size, no-trade conditions and parameters. Save it as a versioned rule card. Then fix the timing between signal and fill, because that is where many backtests quietly cheat.
When can a close-based signal be executed? After the close is known, so no earlier than the next executable price. A close-based signal can be filled at the next session's open, or at a later quote, but not at the close that created it.
Candle-Close Signals
Reading a candle's final close after it finishes is legitimate. Assuming you traded at a price earlier than the signal is not. The rule to keep is information before decision, and decision before fill.
Entry at the Next Executable Quote
Choose the fill model before testing and apply it to every trade: for example, the next open, or the first quote after a stated delay. Use the ask for buys and the bid for sells if you have quote data. If you have only OHLC bars, say so, and treat any fill inside a bar as an assumption.
Market Hours and Order Rules
Check that every simulated order is placed when the market is open and that your order type could actually fill. A limit order may not fill, and a stop may fill at a worse price. The guide to stop-loss market and stop-loss limit orders explains why.
Worked Example: Same-Close Bias
A rule is invented to show how one timing error changes one trade. The rule: buy after a daily candle closes above a 20-day moving average, then exit at the next session's close. All prices are invented, and one unit is traded.
| Event | Price | What is known | Allowed action |
|---|---|---|---|
| Day 1, after the close | ₹240 | The close is ₹240; the moving average is ₹236, so the rule is met | Generate the buy signal; do not assume a fill at a price fixed before the signal was known |
| Day 2, the open | ₹246 | The next session has opened | Enter at ₹246 under a next-open fill assumption |
| Day 2, the close | ₹243 | The close is known and the rule exits | Exit at ₹243 |
Invalid Same-Close Fill
If the test fills at the Day 1 close of ₹240, gross P&L is 243 − 240 = +₹3. That fill was not available: the close was needed to make the signal, so the order could not be placed at that price.
Legitimate Next-Open Fill
Filling at the next open of ₹246 gives 243 − 246 = −₹3.
| Version | Entry | Exit | Gross P&L per unit | Net with an assumed ₹1.50 cost |
|---|---|---|---|---|
| Invalid: same-close fill | ₹240 | ₹243 | +₹3.00 | +₹1.50 |
| Valid: next-open fill | ₹246 | ₹243 | −₹3.00 | −₹4.50 |
Difference: +₹3 minus (−₹3) = ₹6 per unit of entry-timing distortion in this invented path. For 50 units, that is ₹300. The loss on the valid version is not proof that the rule always loses. It shows that the invalid fill turned a loss into a gain.
How Do You Run a Backtest Step by Step?
Follow the steps in order, and keep a record of each so someone else could reproduce the result.
- Choose the universe and period. Decide which instruments, which dates and which timeframe, using a rule set in advance, and write down what you exclude and why.
- Capture as-of data. Save a raw sample and a data dictionary with release or observation timestamps, the data source and the date you downloaded it.
- Pre-register the rules. Save the rule card with a version number before any result is seen. If you change a rule later, create a new version and start the validation again.
- Simulate in chronological order. Step through time and let each decision use only data released before it. Do not compute indicators over the whole history and then trade from them.
- Log every fill. Record the trade ID, information time, signal time, fill time, fill price, exit time, exit price, units, costs and rule version.
- Apply costs and stress them. Add spread, slippage and fees per completed trade, then test higher costs and a delayed fill, for example one bar later.
- Review and decide. Read the worst trades, the drawdown and the concentration of results, ask whether anyone else could reproduce them, then write a decision memo.
The Trade Log
The log is your evidence. Each row should let a reviewer check that the information time is not after the signal time, and the signal time is before the fill time. A reviewer who cannot do that from the log cannot trust the P&L. Keep the log as a plain table or CSV, so it can be re-checked without your software. A journal habit helps here: see what to write down on your first paper trade.
How Do You Validate on Unseen Periods?
Clean, point-in-time data does not prove that a rule generalises. Two separate ideas are often confused, and you need both.
| Point-in-time (as-of) integrity | Out-of-sample validation | |
|---|---|---|
| Question | Could the model have known this at that time? | Does a rule tuned on one sample work on another? |
| Catches | Future-data leakage and impossible trades | Overfitting to the tuning sample |
| Does not catch | A rule that is overfitted | Bad timestamps or missing costs |
Research Sample vs Locked Test Sample
Split your history in time order into a research (training) sample, a validation sample and a locked test sample. As an illustration, for 1,000 daily bars you might use the first 600 for research, the next 200 for validation and the final 200 as a locked test. Tune on the research sample, check on the validation sample, and evaluate the locked test sample once. If you change the rule after seeing the locked test, it is no longer untouched.
Rolling Walk-Forward
Walk-forward testing repeats the idea: fit on an earlier window, freeze the rule, test on the next window, then roll forward. It tests whether the tuning procedure generalises. It does not repair bad timestamps.
Stress by Regime
Split results by market conditions, such as trending, ranging, calm and volatile periods. A rule that only works in one regime is a different claim from a rule that works across several. Choose actual windows after reviewing the asset's history and the sample size.
How Do You Add Costs and Realistic Fills?
Costs apply to every completed round trip, so they compound quickly with trade count. Model them explicitly, with units, and test them at several levels. Why paper profits vanish after costs: net P&L = gross P&L − (number of round trips × cost per round trip).
Spread, Fees, Slippage and Partial Fills
Spread is the gap between bid and ask that you cross. Fees are brokerage and charges. Slippage is the difference between your assumed price and your fill. Partial fills mean you may not trade your whole size at once. Keep each cost on its own line, and record the assumed size and the units. The bid, ask and LTP guide explains why the price you see is not always the price you get.
Cost Sensitivity
An invented trade log: 50 completed round trips, gross P&L of +₹7,500 before costs. Assume a combined cost of ₹165 per round trip (spread, slippage and fees). Total cost is 50 × ₹165 = ₹8,250, so net P&L is ₹7,500 − ₹8,250 = −₹750.
| Cost per round trip | ₹0 | ₹50 | ₹100 | ₹150 | ₹165 |
|---|---|---|---|---|---|
| Net P&L over 50 trades | +₹7,500 | +₹5,000 | +₹2,500 | ₹0 | −₹750 |
The break-even cost is ₹7,500 ÷ 50 = ₹150 per round trip. This is a scenario, not a quote of any real fee schedule or an estimate for any strategy.
How Do You Read Performance Without Overclaiming?
A single headline number hides how a result was produced. Look at four measures and the trade distribution, and treat none of them as a pass mark.
Expectancy, R and Drawdown
Expectancy is the average net P&L per trade. In the cost example, gross expectancy is ₹7,500 ÷ 50 = ₹150 per trade, and net expectancy at ₹165 is −₹15. Average R is net P&L divided by the initial risk on each trade. Maximum drawdown is the largest fall from a peak to a later low in cumulative net P&L. Profit factor is total gross profit divided by total gross loss. No value of any of them is a universal pass mark.
Distribution, Outliers and Sample Size
Check whether a few trades carry the result. Suppose 5 of the 50 invented trades made ₹6,000 of the ₹7,500. That is 80 percent from 10 percent of trades, and the other 45 trades made ₹1,500, about ₹33 each, well below a ₹165 cost. There is no magic number of trades. Think about uncertainty, whether trades are independent, costs and different regimes. A high win rate alone says little, because small frequent wins can sit beside rare large losses. See the swing trading risk management guide for sizing and drawdown context.
Backtest Bias Audit Checklist
A "yes" needs evidence you can show: a document, a code rule, a dated data extract or a trade log. A verbal claim does not count.
The 10 Gates
| # | Gate | Question | Evidence to keep |
|---|---|---|---|
| 1 | Data source and coverage | Do all gaps, delistings, rollovers and corporate actions have an explicit treatment? | Raw sample and data dictionary |
| 2 | Point-in-time availability | Could each bar, filing, constituent and factor value have been known at that time? | As-of release timestamps |
| 3 | Rule freeze | Were entries, exits, stops, sizing and parameters fixed before the locked test was seen? | Versioned rule card |
| 4 | Signal and execution sequence | Does each fill come after its signal, with coherent open, close and next-bar assumptions? | Signal time against fill time |
| 5 | No repaint or leakage | Are centred indicators, full-day highs and lows, and future ranks excluded from decisions? | Code audit and bar-by-bar replay |
| 6 | Realistic friction | Are spread, slippage and fees modelled for your trade size? | Cost model and sensitivity test |
| 7 | Independent test sample | Is there an untouched locked test sample, or rolling windows not mined for parameters? | Train, validate and test schedule |
| 8 | Regime and concentration | Does performance survive more than one regime, and not hinge on a few trades? | Per-regime and worst-trade tables |
| 9 | Robustness | Do modest cost rises, delays or small parameter changes break the result? | Sensitivity table and delay test |
| 10 | Reproducible report | Can someone reproduce the result from inputs, rule version, costs and a time-stamped trade list? | Source log and P&L reconciliation |
Pass, Fail and the Decision Memo
Any gate answered "no" means reject, or revise and retest on a new test sample. All "yes" with evidence means the rule may go to forward paper trading, and nothing more. Write a one-page memo: strategy and version, universe, data and as-of source, execution assumptions, costs, validation windows, net expectancy, worst drawdown, failures found, and the decision (reject, revise and retest, or paper trade only). The audit worksheet has the gates, a trade-timing check and the cost table.
Backtesting vs Bar Replay vs Paper Trading
Each stage answers a different question, and none of them proves a rule will work live.
| Stage | What it checks | Main limitation |
|---|---|---|
| Historical backtest | Whether a written rule was tradable across many dates, under stated costs | Simulated fills; data and model errors |
| Bar replay | Whether you can apply the rule candle by candle without hindsight | Small samples; your own judgement shapes it |
| Forward paper trading | Whether the rule behaves on data that did not exist when you wrote it | Simulated fills; fewer trades per month |
Moving Between Stages
Use the same rules at every stage, and change them only by creating a new version. Each stage should add evidence, not new tuning. Move on only if the audit passed. Stop and revise if the net result depends on the costs you picked, or on a handful of trades. Paper fills remain simulated, so a paper result does not guarantee live execution.
Common Mistakes and Limits
| Failure symptom | Audit step |
|---|---|
| Results look unusually smooth | Re-check gates 2, 4 and 5: information times and fills |
| Strong only on chosen dates | Gate 7: choose samples by a rule, and include poor periods |
| Works at one parameter value only | Gate 9: test small parameter changes |
| Profit disappears with costs | Gate 6: apply and stress the costs |
| Delisted names missing | Gates 1 and 2: rebuild the universe as it stood then |
| Result rests on a few trades | Gate 8: read the worst and best trades, and test without them |
Absolutes to Avoid
Some rules of thumb you may see are unverified heuristics: a fixed number of trades that "proves" an edge, a single profit factor that is "acceptable", or a rule that only one candle offset is valid. Timing and context decide.
Over-Optimising and Corporate-Action Errors
Tuning until the curve looks smooth is overfitting. Unadjusted splits or bonus issues can create fake signals. Both are found by the audit, not by a better-looking chart.