
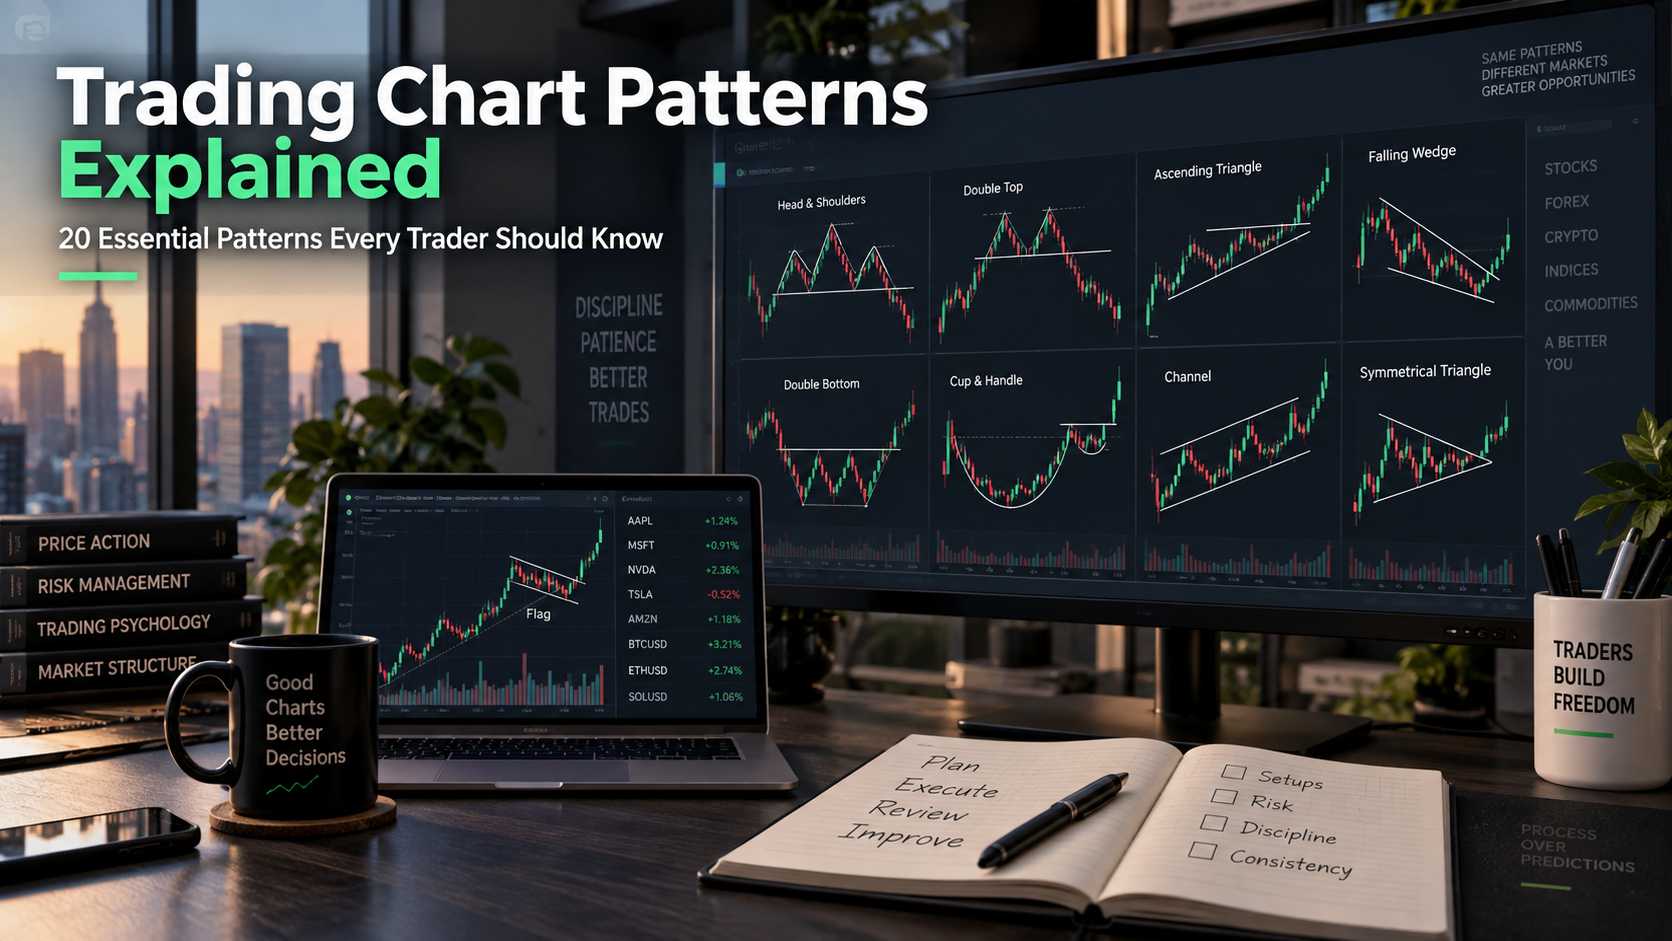
Reversal patterns: signals a trend might be turning
These show up when buying or selling pressure is running out of steam, hinting the current trend could flip direction.
| # | Pattern | Signals | What to look for |
|---|---|---|---|
| 1 | Head and Shoulders | Uptrend turning down | Three peaks, the middle one taller than the two either side |
| 2 | Inverse Head and Shoulders | Downtrend turning up | Three troughs, the middle one deeper than the two either side |
| 3 | Double Top | Uptrend turning down | Two peaks at a similar level, forming an M shape |
| 4 | Double Bottom | Downtrend turning up | Two troughs at a similar level, forming a W shape |
| 5 | Triple Top | Uptrend turning down | Three peaks holding at a similar level |
| 6 | Triple Bottom | Downtrend turning up | Three troughs holding at a similar level |
| 7 | Rounding Bottom (Saucer) | Downtrend turning up | Slow, gradual U-shaped curve |
| 8 | Rounding Top | Uptrend turning down | Slow, gradual inverted U-shaped curve |
| 9 | Spike Top (V-reversal) | Uptrend turning down, sharply | A sudden, sharp single-peak reversal with no real warning |
| 10 | Diamond Top/Bottom | Trend exhaustion, either direction | Price swings widen, then narrow, forming a diamond shape |
Notice the pattern in the patterns, so to speak. Most reversal shapes are really just "price tests a level, fails, tests it again," repeated two, three, or more times until the market gives up trying.
Continuation patterns: signals a trend is just pausing
These show up mid-trend, a breather before price picks the same direction back up.
| # | Pattern | Signals | What to look for |
|---|---|---|---|
| 11 | Bull Flag | Uptrend pausing, then continuing up | Small, downward-sloping rectangle after a sharp rise |
| 12 | Bear Flag | Downtrend pausing, then continuing down | Small, upward-sloping rectangle after a sharp drop |
| 13 | Pennant | Trend pausing, either direction | Small symmetrical triangle right after a sharp move |
| 14 | Ascending Triangle | Often resolves upward | Flat resistance on top, rising support underneath |
| 15 | Descending Triangle | Often resolves downward | Flat support underneath, falling resistance on top |
| 16 | Symmetrical Triangle | Neutral, can break either way | Narrows from both the top and bottom at once |
| 17 | Rectangle | Trend pausing, either direction | Price bounces between a clear support and resistance level |
| 18 | Cup and Handle | Usually resolves upward | Rounded dip, then a small pullback, before breaking higher |
| 19 | Rising Wedge | Often bearish, watch the context | Narrowing range that slopes upward |
| 20 | Falling Wedge | Often bullish, watch the context | Narrowing range that slopes downward |
Wedges are the odd ones out here, worth a specific note. They can act as either reversal or continuation patterns depending on where they show up in the broader trend, which is exactly why context matters more than memorizing a fixed rule for them.
How can I tell whether a pattern is reversal or continuation?
Look at what the trend was doing right before the pattern started forming. If price had been climbing steadily and then starts carving out a shape like a head and shoulders or a double top, that's forming against the existing trend, a classic reversal setup. If price had been climbing, paused briefly into something like a flag or a triangle, and the overall trend context still looks intact, that's a continuation pattern, a pause rather than a genuine turn.
The location matters as much as the shape itself. The exact same triangle shape can be read completely differently depending on whether it shows up after a long, tired uptrend, more likely a reversal warning, or in the middle of a fresh, strong trend, more likely just a pause. Shape alone, divorced from context, tells you less than people assume.
How reliable are head and shoulders, triangles, flags, and double tops, really?
Reliable enough to be worth learning, not reliable enough to trade blindly. None of these patterns come with a fixed, trustworthy success rate, and any content quoting you a specific percentage, "head and shoulders works 83% of the time", is making that number up, since real-world reliability shifts constantly with market conditions, the specific stock, and how cleanly the pattern actually formed.
What actually affects reliability: volume confirming the breakout, how cleanly the pattern formed versus how much you're squinting to see it, and the broader market environment the pattern's forming in. A head and shoulders on strong breakdown volume, in a market already trending down, carries a lot more weight than the same shape on thin volume during a quiet, directionless week. Treat every one of these twenty patterns as a probability tilt, not a certainty, and you'll use them a lot more effectively than someone expecting a guarantee.
How do I confirm a chart pattern before entering a trade?
Wait for the actual breakout, not just the shape looking complete. A head and shoulders isn't confirmed until price actually breaks the neckline. A triangle isn't confirmed until price actually pushes through its upper or lower boundary. Entering based on "it looks like it's about to happen" skips the one step that separates a real signal from a guess.
Check volume at the moment of that breakout. A breakout on rising volume carries real weight, since it suggests genuine participation behind the move. A breakout on quiet, thin volume is far more likely to fail or reverse, and plenty of textbook-looking patterns fall apart for exactly this reason. And use the pattern's own structure to set your stop-loss, just below the neckline, just outside the triangle's edge, so you've got a defined exit if the pattern turns out to be one of the ones that doesn't work.
Neostox's charting tools let you study all twenty of these patterns forming in real time across equities, futures, and options, on live NSE and BSE market conditions, and paper trading gives you a place to practice spotting them, waiting for genuine confirmation, and setting stops around them, all with virtual money while you're still building the eye for it.