
What is the best stock charting software for traders?
It depends entirely on what you're optimizing for, and being upfront about that matters more than pretending one type of platform wins across the board.
- Best for broad, global technical analysis with a large indicator library and custom scripting: A dedicated, general-purpose charting platform built for multi-asset coverage.
- Best for India-focused charting with exchange-specific tools: A platform purpose-built around NSE, BSE, and MCX data specifically.
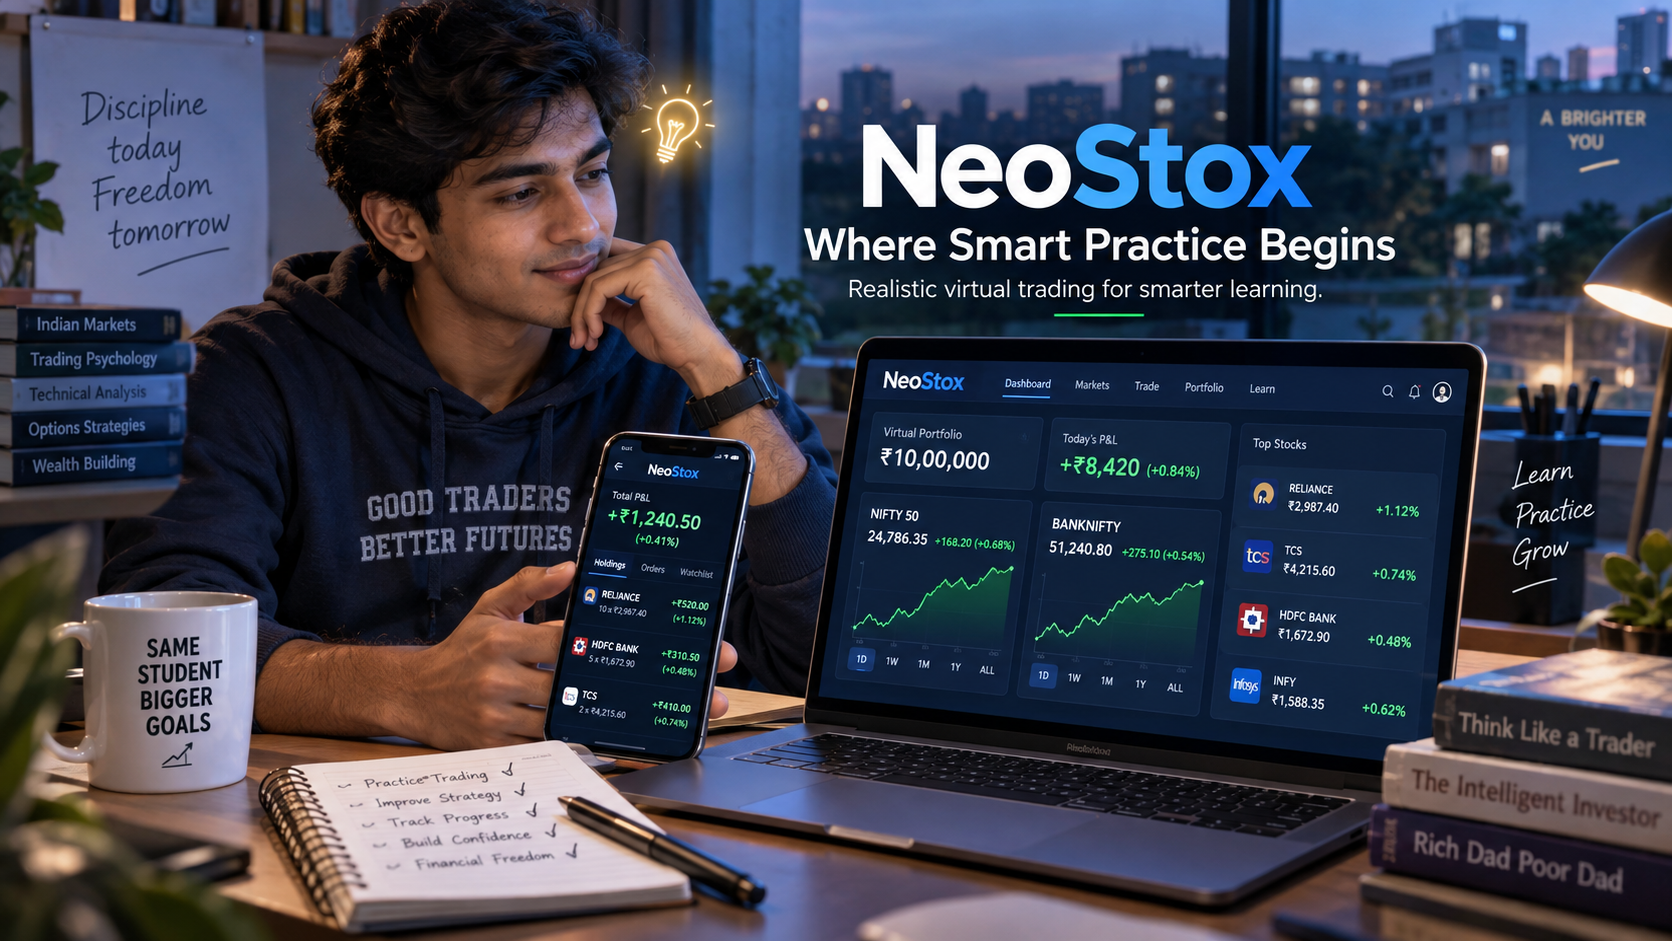
- Best if you want your charting connected directly to a place you can actually practice the trade, not just analyze it: A platform like Neostox, which bundles charting with live-condition paper trading across equities, futures, and options on NSE and BSE.
None of these categories is universally "better," they're built around different priorities. The rest of this guide breaks down what to actually check before choosing.
What actually makes charting software good for technical analysis?
A strong charting platform for serious technical analysis needs a genuinely deep indicator library, ideally including community-built or custom indicators you can add beyond the defaults, since the built-in set rarely covers everyone's specific approach. Custom scripting matters too if you want to build or adapt your own indicators and strategies rather than relying entirely on presets.
Check the free tier carefully before assuming it covers what you need. Most platforms cap how many indicators you can layer on a single chart or limit alerts on their free plan, which pushes serious, frequent users toward a paid tier fairly quickly. And if you're trading globally, confirm the platform covers the specific asset classes and exchanges you actually need, since some are built broadly across stocks, crypto, and forex, while others focus tightly on one market.
What should I look for in a free charting platform?
Start by checking whether "free" actually means real-time data, or whether the free tier runs on data delayed by 15 minutes or more, a distinction that matters enormously if you're studying intraday setups versus slower, swing-style patterns. Confirm how many indicators and alerts the free tier actually allows, since a plan that only lets you add two indicators to a chart won't support serious multi-factor analysis.
If your priority is charting paired with the ability to actually practice a trade on what you're looking at, rather than analysis alone, check whether the platform includes any form of simulated trading, or whether you'd need to connect it to a separate broker or simulator entirely. Neostox's charting tools, for instance, come built directly into its paper trading platform at no cost to start, covering equities, futures, and options on live NSE and BSE conditions, so there's no separate tool to bridge.
What should Indian stock market traders specifically look for?
For traders focused on Indian markets, prioritize platforms with dedicated NSE, BSE, and MCX coverage and scanning tools built around Indian market structure specifically, rather than a general global platform where Indian exchange support feels secondary to broader international coverage. If your trading spans international markets alongside Indian ones, broader multi-asset coverage becomes more valuable even if it's less specifically tailored to Indian exchange nuances.
If what you actually want is to study Indian market charts and then test a trade idea with virtual money in the same place, rather than jumping between a charting tool and a separate broker or simulator, that's a specific use case worth checking for directly, and it's exactly what a platform like Neostox is built around.
What should I check for real-time data, indicators, alerts, and backtesting?
| Feature to check | What to look for | Why it matters |
|---|---|---|
| Data speed | Confirm whether real-time or delayed, and by how much | A 15-minute delay barely matters for swing trading, but seriously distorts intraday analysis |
| Indicator library | Built-in variety plus community or custom indicator support | A limited indicator set restricts how deeply you can analyze a setup |
| Custom scripting | Whether you can build your own indicators or strategies | Matters most for traders with a specific, non-standard approach |
| Alerts | How many, and on which plan tier | Free tiers often cap alerts tightly, check before relying on them |
| Backtesting | Whether the platform supports testing a strategy against historical data | Useful for validating an idea before risking anything on it |
| Paper trading or simulated execution | Whether it's built in, or requires a separate platform | Determines whether you can move from analysis to practice in one place |
| India-specific exchange depth | NSE/BSE/MCX coverage and India-focused tools | Matters more if your trading is exclusively in Indian markets |
| Cost to start | Free tier availability and what it actually includes | Confirm exactly what's free versus gated behind a paid plan |
Use this table as a checklist against any specific platform you're evaluating, rather than assuming any single provider automatically checks every box.
Decision criteria - how to actually choose
Choose a broad, general-purpose charting platform if you want the deepest indicator and scripting ecosystem, trade across multiple asset classes or global markets, and don't mind paying for a premium tier once you outgrow a free one. Choose an India-focused charting platform if your trading is squarely in Indian markets and you want exchange-specific tools without paying for features built around global markets you don't trade. Choose a platform like Neostox if what you actually want is charting connected directly to practice, studying a setup and then testing it with virtual money in the same place, rather than analyzing on one platform and simulating on another.
These aren't mutually exclusive either. Plenty of traders use a dedicated charting platform for deep analysis and a simulator separately for practicing execution, since the two tools solve genuinely different problems.
Limitations worth knowing
General-purpose charting platforms with the deepest feature sets often gate serious functionality, multiple indicators per chart, extensive alerts, deeper backtesting, behind paid tiers, so free access rarely covers heavy daily use. India-focused platforms, while strong on local exchange coverage, sometimes have a smaller community and third-party script ecosystem to draw on compared to larger global platforms.
Charting bundled inside a simulator, Neostox included, generally won't match a dedicated charting platform's depth of custom indicators and scripting, since the core focus is practicing trades, not building bespoke technical analysis tools. Know which tradeoff you're making before you settle on one platform for everything.