
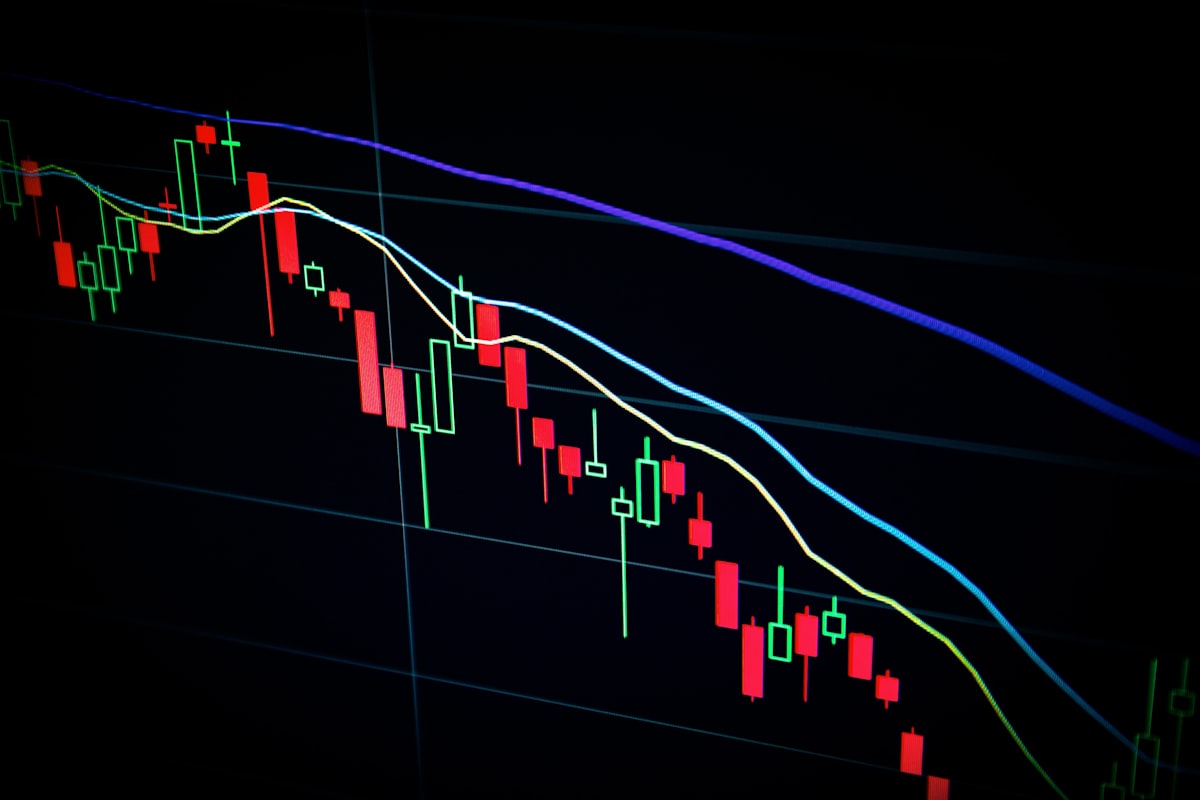
You add VWAP and a moving average to a chart. Both look like average-price lines, but they sit in different places. One says the price is above average; the other puts it below. Which one should you believe?
First, check what each line is averaging. VWAP gives more weight to prices with more traded volume. A simple moving average, or SMA, gives equal weight to the prices in its chosen window. They can also start counting from different points.
For this VWAP vs moving average comparison, we'll use a tiny made-up set of prices you can calculate yourself. We're comparing an SMA specifically; other moving averages use different methods.
Start with the volume
VWAP means volume-weighted average price. In its transaction-level form, add price multiplied by quantity across the selected trades, then divide by their total quantity. Trades with more volume contribute more to the result.
Charting software may calculate a bar-based version using a selected price source and each bar's volume. A common source is typical price: high plus low plus close, divided by three. That’s an approximation based on bars, rather than a full reconstruction of every transaction.
Before comparing indicators, make sure the chart's price and volume observations are clear. Neostox's beginner's guide to reading trading charts explains those building blocks. Then check the VWAP source and anchor in your actual chart settings rather than assuming every platform uses the same inputs.
Three trades are enough to see the difference
Imagine just three hypothetical trades: ten shares at ₹100, ten shares at ₹110 and 80 shares at ₹120. Their traded values are ₹1,000, ₹1,100 and ₹9,600. Total traded value is ₹11,700 and total volume is 100 shares.
The transaction-level VWAP across those trades is ₹11,700 ÷ 100 = ₹117. The largest trade has pulled the result closer to ₹120 because it accounts for most of the volume.
A simple unweighted average of the three trade prices would be (₹100 + ₹110 + ₹120) ÷ 3 = ₹110. That seven-rupee difference doesn’t indicate an error. The calculations answer different averaging questions.
This example uses individual trades solely to show the weighting. Don’t expect it to reproduce a bar-based chart indicator unless the underlying data and price source also match.
Give each price equal weight instead
A three-period SMA of closing prices adds the last three closes and divides by three. If those closes are ₹100, ₹110 and ₹120, the SMA is ₹110. Each close has equal weight, regardless of the volume traded during its bar.
When a new bar closes at ₹130, the oldest close drops out. The next SMA becomes (₹110 + ₹120 + ₹130) ÷ 3 = ₹120. This rolling window is why the average moves as new bars arrive.
The period refers to bars on your selected timeframe, so a 20-period line on a five-minute chart is different from a 20-period line on a daily chart. Neostox's guide to indicators and timeframes explains moving averages and how the chart interval changes what you’re measuring.
Session VWAP starts counting again when the selected session begins. Within that session, it accumulates price-and-volume observations from the starting point. That starting point is called the anchor.
An ordinary rolling SMA doesn’t reset simply because a new session begins. It keeps the most recent specified number of eligible bars, which may include bars from the previous session depending on chart settings.
Other VWAP anchors can start from a week, month or selected event. Don’t compare an event-anchored line with session VWAP and assume one is broken. Check the anchor, session coverage and price source first.
Go back to the two lines on your chart
It means the current price is above the calculated volume-weighted average for the selected interval and source. That’s a description of its relationship to past observations. It doesn’t establish why the price moved or where it will go next.
Likewise, price above an SMA means it is above that particular rolling price average. A recent rally can put the price above both lines, but the lines may react differently because one weights volume and the other uses equal-weighted closes.
A late-session move can also look different from an early-session move. By late session, cumulative VWAP includes more earlier activity. Its response to a small new observation can therefore be limited by the volume already in the calculation.
Check that both charts use the same inputs
Start by checking whether both charts show the same instrument. A stock, its future and an option on it have different traded prices and volumes. A VWAP derived from one can’t simply be treated as the other instrument's average execution price.
Then compare the data feed, bar timeframe, included sessions, anchor and price source. Missing volume or different session coverage can also affect the line. If you’re looking at an index, check what the chart’s volume field represents.
Neostox's indicator comparison explains why tools should be selected by what they measure. The same principle applies here: understand the input before interpreting the output.
A useful manual check is to calculate a short SMA from three completed bars before adding more settings. Then inspect whether your chart is using the current unfinished bar as well. A live bar can change its close and volume before completion, so a moving line during that bar isn’t automatically evidence of a faulty indicator.
Save the settings with your observation notes so you can reproduce the comparison later.
Use one instrument and one observation period. Write down the VWAP anchor and source, the SMA length and source, and the chart timeframe. Keep those settings unchanged during the comparison.
Observe when price sits above both lines, below both lines or between them. Record what happened next, including cases that contradicted your expectation. Record the messy examples too. A few neat crossings won’t tell you whether a trade based on them would work.
You can use the Neostox charting workspace to study price structure and available chart controls. Check that your current interface provides the specific indicator and settings needed for the exercise. The website currently states that market prices are delayed by 30 days.
Our little example gave a volume-weighted price of ₹117 and an equal-weighted price average of ₹110. Neither calculation needed to be fixed. Most of the shares traded at the higher price, so volume weighting moved the answer closer to it.
When the two lines disagree on your chart, check their inputs with that example in mind. Once you know the source, window and starting point, you can explain the difference. You don't have to turn every disagreement into a buy or sell decision.