
What are the most commonly used indicators for swing trading?
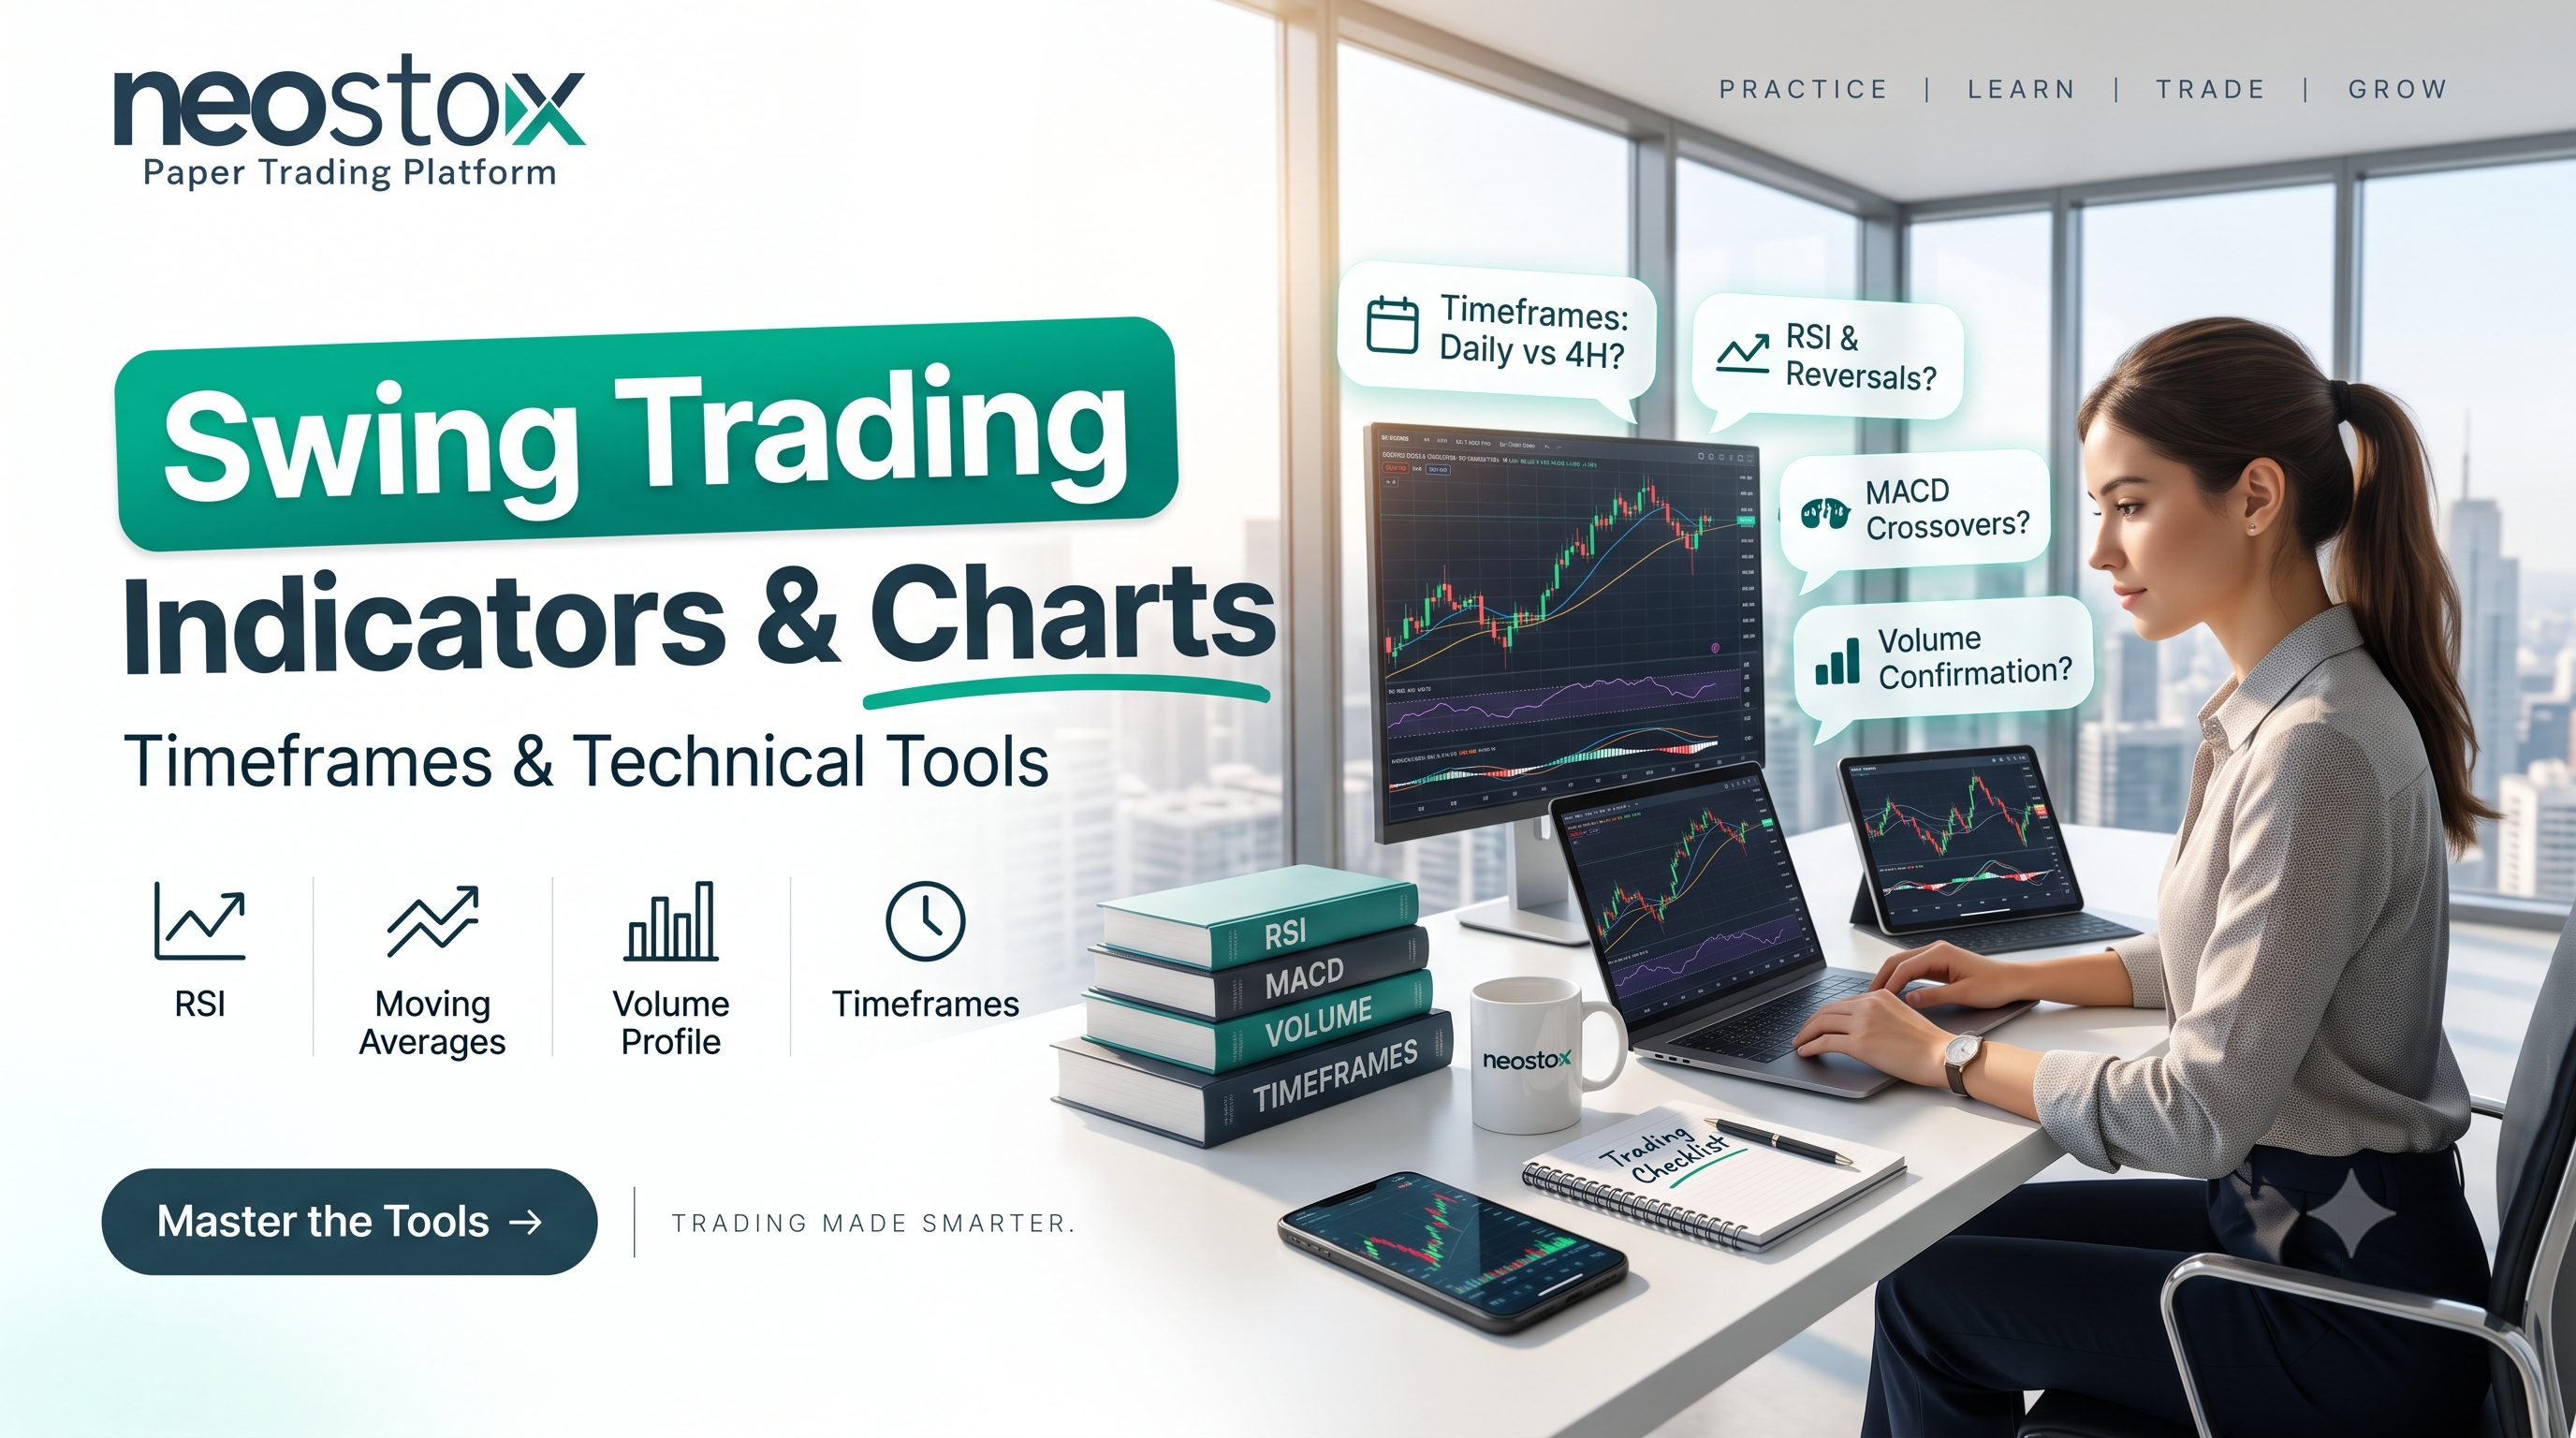
A handful of tools cover most of what swing traders actually lean on, each measuring something genuinely different. Moving averages measure trend direction. RSI and MACD both measure momentum, from slightly different angles. ATR measures volatility. Volume measures participation. None of these are interchangeable, and understanding what each one is actually built to detect matters more than knowing the "right" settings for any of them.
How are moving averages used in swing trading?
A moving average measures trend direction, smoothing out day-to-day noise to show you the broader path price has actually been taking. When price sits above a rising moving average, that's a trend context favoring long setups. Below a falling one, the opposite. Swing traders commonly use a 20-period average for near-term trend context and a 50 or 200-period average for the bigger picture.
This ties directly into the pullback strategy covered in a companion guide, since the moving average often is the support level a trend pulls back to before resuming.
What is the difference between SMA and EMA for swing trading?
A simple moving average (SMA) weighs every price in its lookback period equally. An exponential moving average (EMA) weighs recent prices more heavily, reacting faster to new movement. Neither is strictly better, they answer slightly different questions. An EMA gives you a quicker read on a shifting trend, useful when timing matters. An SMA gives you a smoother, steadier read, less prone to reacting to a single sharp move that might not mean much.
Many swing traders use both together, an EMA for faster context, an SMA for the broader, steadier trend, rather than picking one exclusively.
How is RSI used for swing trading?
RSI, the Relative Strength Index, measures momentum, specifically how fast and how far price has moved recently, expressed on a 0 to 100 scale. Traditionally, readings above 70 suggest a stock's gotten overbought, readings below 30 suggest oversold, though these thresholds shift somewhat depending on the specific stock and market condition.
Swing traders often use RSI to gauge whether a pullback within a trend has stretched far enough to represent a genuine entry opportunity, or whether a stock's run has gotten stretched enough that a reversal or pause looks more likely.
How is MACD used for swing trading?
MACD, Moving Average Convergence Divergence, also measures momentum, but from a different angle than RSI, tracking the relationship between two moving averages of different lengths, typically 12 and 26 periods, plus a signal line built from that difference. When the MACD line crosses above its signal line, that's often read as strengthening upward momentum. A cross below suggests the opposite.
Where RSI is more useful for spotting overbought and oversold extremes, MACD tends to be more useful for confirming a shift in trend or momentum direction as it's actually happening, a genuinely different job even though both measure momentum broadly.
Can RSI and MACD be used together? Which is better, RSI or MACD?
Neither is universally better, they measure momentum from different angles and often work well together rather than as competitors. RSI is generally stronger at flagging overbought and oversold extremes within a range or a pullback. MACD is generally stronger at confirming a genuine shift in trend momentum through its crossover signal.
Used together, RSI can flag that a pullback's reached a stretched, potentially exhausted level, while MACD can help confirm whether momentum's actually turning back in your favor before you act on that RSI reading. That combination is complementary specifically because the two tools are looking at momentum through different lenses, not because either one is simply superior to the other.
What does volume tell a swing trader?
Volume measures market participation, how many shares are actually changing hands, not price direction itself. A price move on strong volume reflects genuine conviction behind it. The same move on weak volume is a far less trustworthy signal, more likely to fade or reverse.
This is exactly why volume confirmation matters so much for breakout setups specifically, covered in more depth in a companion guide, a breakout without real volume behind it is one of the clearest false-breakout warning signs available.
How can ATR help with swing trading?
ATR, Average True Range, measures volatility, specifically the average size of an instrument's price movement over a recent period, typically 14 days. It says nothing about direction, purely about magnitude, how much a stock typically moves, regardless of which way.
This has a genuinely practical use beyond just gauging volatility in the abstract, setting stop-loss distance. Rather than placing a stop at an arbitrary fixed percentage below entry, some swing traders set it at a multiple of current ATR, say two times ATR below entry, so the stop naturally widens on a more volatile stock and tightens on a calmer one. This connects directly to the invalidation-point framework covered in a companion strategy guide, ATR gives you a volatility-adjusted way to think about where that invalidation point should actually sit.
Are Bollinger Bands useful for swing trading?
Yes, and they measure something related to but distinct from ATR, relative volatility and price extremes around a moving average, typically built from a 20-period average plus bands set a couple of standard deviations above and below it. When price pushes toward the upper band, it's stretched relative to its recent range. Toward the lower band, the opposite.
Bands also widen during high volatility and narrow during quiet periods, sometimes called a squeeze, which some swing traders watch as an early signal that a bigger move might be building, without knowing yet which direction it'll break.
How many indicators should a swing trader use?
Fewer than you'd think, genuinely. Two or three, well understood, covering different things, trend, momentum, maybe volatility or volume, tends to work better than a chart cluttered with six or seven indicators all fighting for your attention. More indicators stacked together usually produces more conflicting signals, not more clarity, since you're left deciding which one to trust when they disagree.
Pick indicators that measure different things, not multiples of the same thing, covered in more depth below.
What timeframe is commonly used for swing trading?
The daily chart is the standard default, matching swing trading's typical days-to-weeks holding period reasonably well, each candle representing a full session's worth of price action. Some swing traders layer in a 4-hour chart specifically for entry timing, using the daily chart to establish the broader trend and setup, then dropping to the 4-hour view to time the actual entry more precisely within that context.
There's no single "best" timeframe here, it depends on how often you can realistically check charts and how precise you want your entries to be. A daily-only approach works fine for many swing traders and demands less frequent attention. Adding a lower timeframe for entries adds precision at the cost of checking in more often, similar tradeoff to the multi-timeframe approach covered in a companion guide on chart analysis.
How should indicators be combined without creating redundant signals?
Pick tools from different categories, not multiples of the same category. A moving average for trend, RSI or MACD for momentum, volume for participation, maybe ATR for volatility and stop placement, that combination covers genuinely different information. Stacking RSI alongside another momentum oscillator measuring something very similar just gives you two versions of the same signal dressed up differently, not two independent confirmations.
A simple test: before adding an indicator to your chart, ask what category it falls into, trend, momentum, volatility, or volume, and check whether you already have something covering that same category. If you do, the new indicator is probably adding noise, not insight.
Reading what an indicator actually measures, in real time, on a real chart, sinks in far faster through practice than through a glossary. Neostox's charting tools let you study moving averages, RSI, MACD, and volume across equities, futures, and options on live NSE and BSE market conditions, and paper trading gives you a place to test how these tools actually behave together, with virtual money, before any of it matters with real capital.