
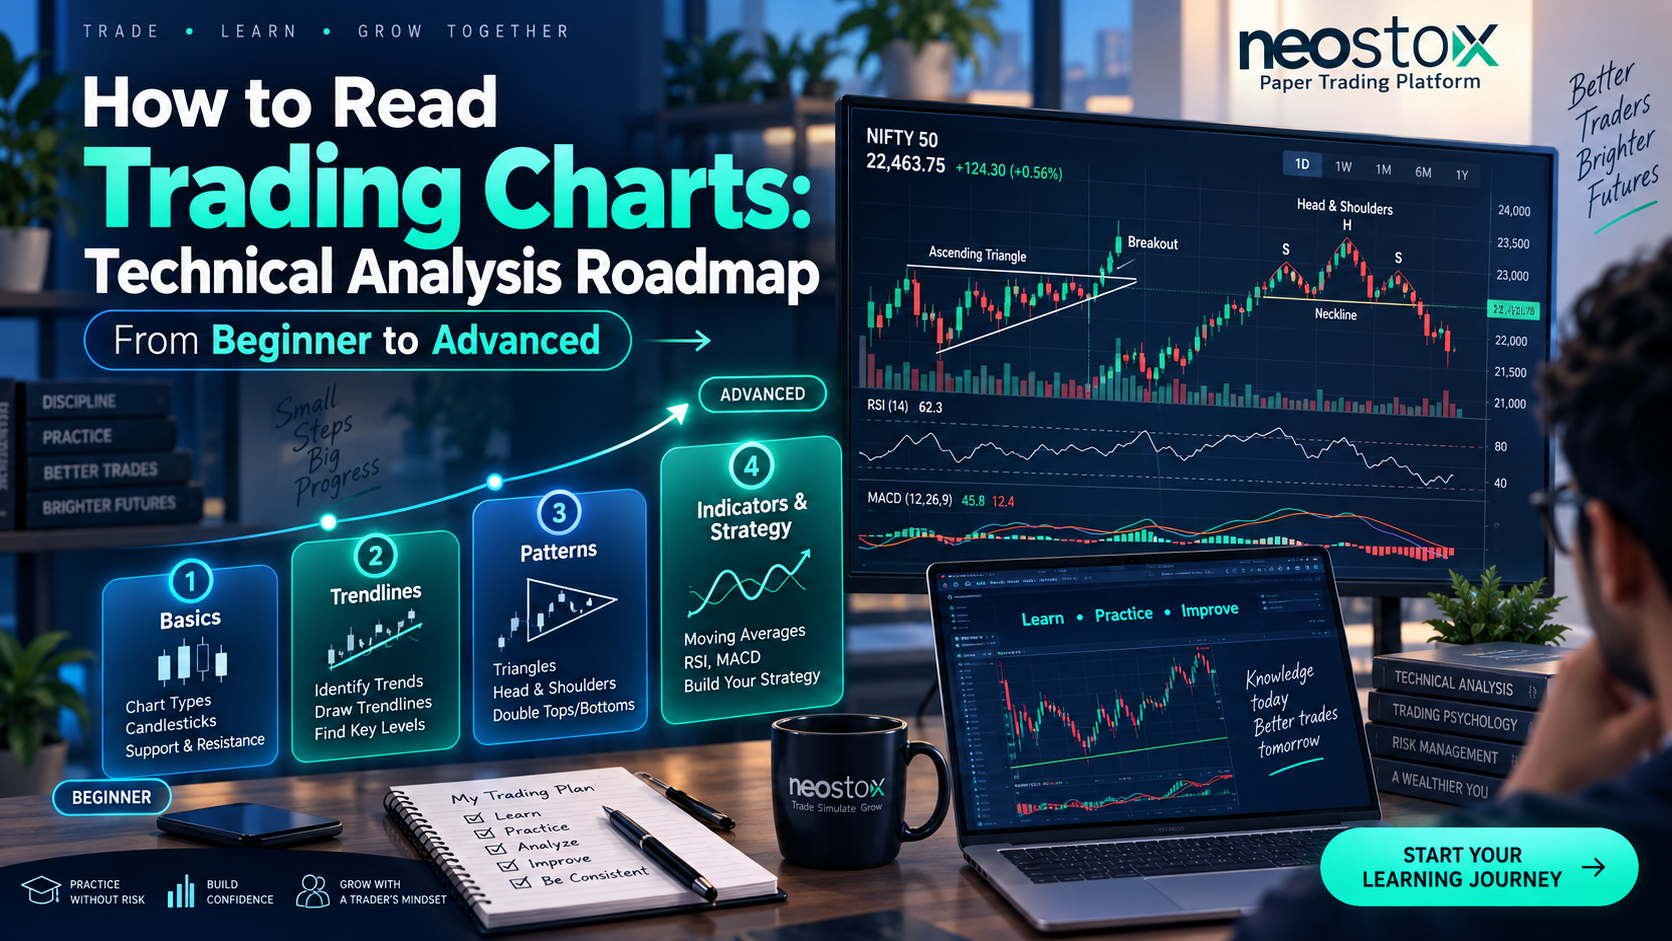
Why the learning order actually matters here
Skip a stage in this roadmap and the next one gets a lot harder to genuinely understand, not just inconvenient, actually harder, since each stage supplies context the next one depends on. Someone who jumps straight to indicators without understanding support and resistance ends up treating indicator signals as magic rather than as a derived summary of price behavior they could've read more directly.
Each stage below stands on its own, you can learn what it teaches without the others, but the sequence is what turns isolated facts into an actual, usable skill.
Stage 1: Learn how prices are actually formed
Learn basic market mechanics before anything else on a chart, because every candle, every indicator, every pattern is just a visualization of buyers and sellers agreeing on a price, and none of it means much if you don't understand that underlying process first.
Understand how an order book works, roughly, and how a trade actually executes when a buy order matches a sell order. This isn't advanced material, it's the foundation everything else sits on, and skipping it is why so many beginners can name a pattern without understanding what it's actually showing them.
Stage 2: Learn to read a single candlestick
Learn a single candlestick before multi-candle patterns, because a candlestick pattern is just several individual candles combined, and you can't read the combination if you can't read one candle properly first.
A candlestick shows four things: the open, the close, and the high and low reached during that period, visualized as a body and two wicks. Get comfortable identifying what a long body versus a small body suggests, and what a long wick on either end tells you about rejected price levels, before moving on to anything more complex.
Stage 3: Learn support and resistance
Learn support and resistance before trendlines or chart patterns, because these price levels are the reference points nearly everything else in technical analysis gets measured against.
Support is a price level where buying pressure has repeatedly stepped in to stop a decline. Resistance is the mirror, a level where selling pressure has repeatedly capped an advance. Once you can spot these reliably on a chart, patterns like double tops and head and shoulders stop looking like abstract shapes and start looking like exactly what they are, price testing a level and reacting to it.
Stage 4: Learn to identify a trend
Learn to identify a trend before studying chart patterns, because a pattern's actual meaning depends entirely on the trend it's interrupting or continuing, the exact same shape can be read completely differently depending on what came before it.
An uptrend shows a series of higher highs and higher lows. A downtrend shows the opposite, lower highs and lower lows. Sideways markets show neither consistently. Get comfortable identifying which of these three you're looking at before trying to layer patterns on top, since pattern interpretation genuinely depends on this context.
Stage 5: Learn to read volume
Learn volume before relying on indicators, because volume tells you how much genuine participation is actually behind a price move, and most indicators are just different mathematical ways of summarizing price and volume you could otherwise read more directly.
A breakout on rising volume carries real weight. The same breakout on thin, quiet volume is far more likely to fail or reverse. Once you're reading volume alongside price, you'll start noticing which patterns and indicator signals are backed by genuine conviction and which ones aren't.
Stage 6: Learn chart patterns
Learn chart patterns before adding indicators to your process, because patterns are built directly from the price, support, resistance, and trend concepts you've already covered, while indicators are a derived, secondary layer calculated from that same underlying price data.
Start with a handful, head and shoulders, double tops and bottoms, triangles, and understand not just their shape but why that shape reflects a real shift in buying or selling pressure. Wait for confirmation before trusting any pattern, and check volume at the breakout, both habits you've already built in the stages before this one.
Stage 7: Learn a small, focused set of indicators
Learn indicators after price action, not before, because indicators work best as confirmation of what price is already telling you, not as a replacement for actually understanding the chart underneath them.
Pick a small set, a moving average or two for trend context, something like RSI for momentum, and learn exactly what each one calculates and why, rather than memorizing a dozen indicator names without understanding any of them deeply. More indicators stacked on one chart rarely means better decisions, it usually just means more conflicting signals to sort through.
Stage 8: Combine everything into a tested, repeatable process
Learn to combine all seven previous stages into one consistent process last, because none of these pieces mean much in isolation, real skill comes from applying them together, consistently, across enough trades to actually trust the results.
Write specific rules: what trend, what pattern, what volume confirmation, what indicator alignment has to be true before you act. Test that process across a real sample, commonly 30 to 50 trades, before trusting it with meaningful capital.
How do support, resistance, trends, candlesticks, indicators, and chart patterns actually work together?
They stack, each one adding context to the one before it, rather than functioning as separate, unrelated tools. A candlestick shows you a single moment of price behavior. Support and resistance show you where that behavior has repeated historically. Trend tells you the broader direction that behavior is unfolding within. Chart patterns are specific, recognizable arrangements of candles forming at or around those support and resistance levels, and their meaning shifts depending on the trend they're forming in. Volume tells you how much conviction is actually behind whatever the pattern or trend is suggesting. Indicators, last in the sequence, summarize combinations of this same price and volume data mathematically, useful as confirmation, not as a standalone replacement for the layers underneath them.
Read in this order, a chart stops being a collection of separate signals and starts being one coherent story about what buyers and sellers are actually doing.
How long does it actually take to learn technical analysis properly?
There's no fixed number of weeks, it depends on how deliberately you practice each stage rather than just how much time passes. Moving through all eight stages with genuine understanding, not just surface familiarity, commonly takes a few months of consistent, focused study and chart practice, followed by a longer stretch of applying it to enough real or simulated trades to actually trust your own reads.
Treat any timeline promising mastery in a week or two with real skepticism. Reading a chart accurately is a skill built through repetition and honest review, the same way any pattern-recognition skill is, and that kind of skill doesn't compress into a weekend no matter how it's marketed.
What's the best step-by-step roadmap for becoming good at chart analysis?
The eight stages above, in that specific order: market mechanics, single candlesticks, support and resistance, trend identification, volume, chart patterns, a small focused set of indicators, and finally combining all of it into one tested process. Each stage exists specifically because the next one depends on it, so working through them in sequence, rather than skipping ahead to whichever part sounds most exciting, is what actually builds real chart-reading skill instead of memorized fragments.
Neostox's charting tools let you practice every stage of this roadmap directly, from spotting a single candlestick to testing a full strategy, across equities, futures, and options on live NSE and BSE market conditions. NeoScreener helps with spotting trend and volume context across stocks, and paper trading gives you somewhere to actually apply the combined process from stage eight with virtual money before real capital is involved.