
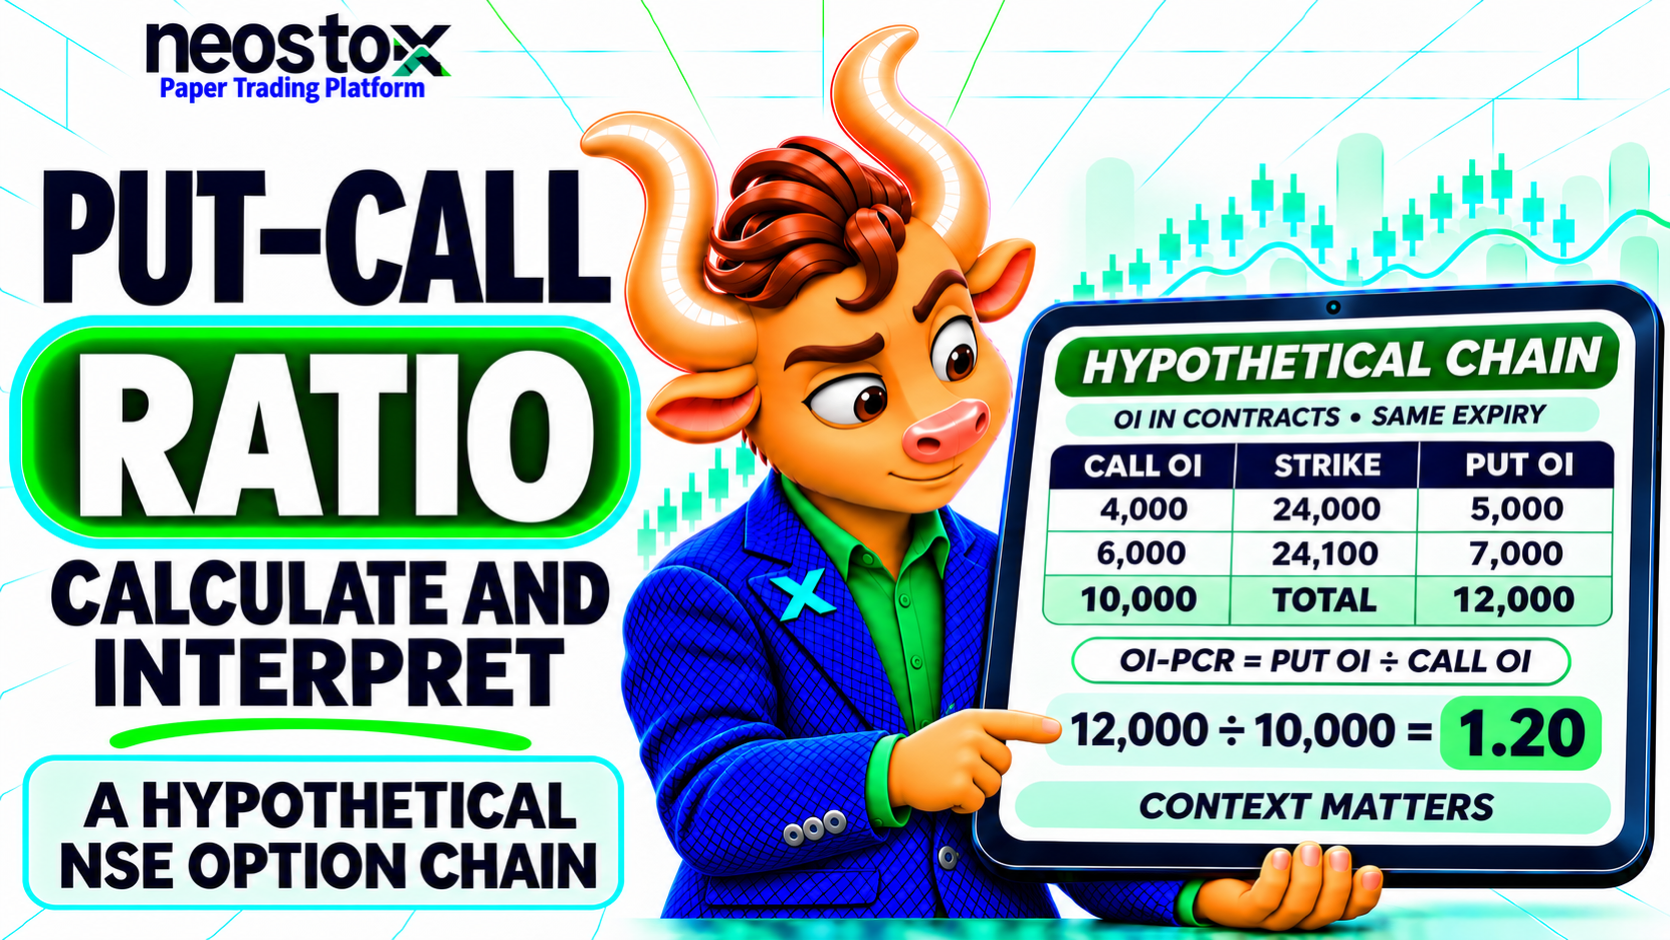
This guide shows the formulas, a worked option-chain example, the step-by-step calculation and the limits of the number. Every figure here is hypothetical and invented for calculation practice. None of it is market data, a quote or a recommendation.
What Is the Put-Call Ratio?
The put-call ratio is the total of put-option activity divided by the total of call-option activity, measured the same way for the same underlying and expiry. A put gives its buyer the right, but not the obligation, to sell at the strike price. A call gives the buyer the right to buy. The two totals can come from trades or from open positions.
A PCR of 0.85 means 85 units of put activity for every 100 units of call activity. The ratio does not say whether traders bought or sold those options. It also does not say whether the index will rise or fall next.
How Do You Read an Option Chain Before Calculating PCR?
An option chain lists contracts for one underlying and expiry, one row per strike price. Most screens place call data on one side of the strike column and put data on the other. For PCR, you need two fields from each row: open interest and volume. Layouts differ between platforms, so check the column labels on yours.
- Open interest (OI): the number of contracts that are still open at the time of the snapshot. It has not been closed, exercised or otherwise settled.
- Volume: the number of contracts traded during the period you choose, often the trading day so far. Volume can be high even when OI barely changes, for example when traders open and close positions quickly.
Set the scope first. Pick one underlying, one expiry, one observation time and one set of strikes. Do not mix indices, expiries, or OI with volume.
Open-Interest PCR vs Volume PCR: The Two Formulas
Both formulas put puts on top and calls underneath. They answer different questions. OI PCR describes the balance of outstanding positions at a moment. Volume PCR describes trading activity over a period.
OI PCR = total put open interest ÷ total call open interest
Volume PCR = total put volume ÷ total call volume
A ratio of 1.00 means the two totals are equal under that measure. Below 1.00, the call total is larger. Above 1.00, the put total is larger. If the call total is zero, the ratio is undefined, not zero.
A Hypothetical Option Chain: Six Strikes
Assume a hypothetical index trading near 24,950 and one unnamed expiry. The table shows only six selected strikes, not a full chain. The numbers are invented.
| Call OI | Call volume | Strike | Put volume | Put OI |
|---|---|---|---|---|
| 18,000 | 5,000 | 24,700 | 9,000 | 62,000 |
| 24,000 | 8,000 | 24,800 | 14,000 | 68,000 |
| 40,000 | 16,000 | 24,900 | 22,000 | 58,000 |
| 66,000 | 30,000 | 25,000 | 27,000 | 49,000 |
| 57,000 | 24,000 | 25,100 | 12,000 | 21,000 |
| 63,000 | 19,000 | 25,200 | 6,000 | 14,000 |
| 268,000 | 102,000 | Total | 90,000 | 272,000 |
Read one row to check your understanding. At the 25,000 strike, 66,000 call contracts and 49,000 put contracts are open, and 30,000 calls and 27,000 puts traded in the chosen period. All counts are in contracts.
How Do You Calculate PCR Step by Step?
Add the put column, add the call column, then divide puts by calls. Do this once for OI and once for volume, and keep the two results labelled. The same six rows give two different answers here, and neither is wrong, because they measure different things.
Step 1: Calculate the OI PCR
Add put OI: 62,000 + 68,000 + 58,000 + 49,000 + 21,000 + 14,000 = 272,000.
Add call OI: 18,000 + 24,000 + 40,000 + 66,000 + 57,000 + 63,000 = 268,000.
OI PCR = 272,000 ÷ 268,000 = 1.0149, or about 1.01.
Across these six strikes, put OI is slightly higher than call OI. That describes this sample only. It is not the PCR of the whole expiry.
Step 2: Calculate the Volume PCR
Add put volume: 9,000 + 14,000 + 22,000 + 27,000 + 12,000 + 6,000 = 90,000.
Add call volume: 5,000 + 8,000 + 16,000 + 30,000 + 24,000 + 19,000 = 102,000.
Volume PCR = 90,000 ÷ 102,000 = 0.8824, or about 0.88.
In this sample, about 88 put contracts traded for every 100 call contracts. The volume PCR sits below 1 while the OI PCR sits just above it. That is not a contradiction. One number counts open positions and the other counts trades.
What Do PCR Readings Below, Equal to or Above 1 Mean?
A reading only tells you which total is larger. The table separates what the arithmetic shows from what it does not.
| Reading | What the arithmetic shows | What it does not show |
|---|---|---|
| Below 1.00 | The call total is larger than the put total | That the index will rise |
| Exactly 1.00 | The two totals are equal | That traders are neutral or prices will stay flat |
| Above 1.00 | The put total is larger than the call total | That the index will fall |
Different educational sources read a high PCR differently. Some treat it as bearish. Some treat an extreme high as a possible contrarian sign. Others see high put OI as consistent with traders selling puts. Every open contract has both a buyer and a seller, and hedges and multi-leg strategies change what a raw total means. No fixed PCR threshold reliably predicts the next move.
Instead of borrowing a "bullish" or "bearish" level from another market, compare a reading with its own history. Use the same underlying, expiry choice, strike range and formula.
Why Does the Strike Range Change the PCR?
The strikes you include change the answer. Here is the same hypothetical chain calculated three ways using OI:
| Strikes included | Put OI | Call OI | OI PCR |
|---|---|---|---|
| Three strikes nearest 25,000 (24,900 to 25,100) | 128,000 | 163,000 | 0.79 |
| The six strikes in the table | 272,000 | 268,000 | 1.01 |
| Six strikes plus two more (24,500 and 25,400) | 349,000 | 324,000 | 1.08 |
The two extra strikes carry 74,000 put OI and 4,000 call OI at 24,500, and 3,000 put OI and 52,000 call OI at 25,400. The reading moves from below 1 to above 1 only because the scope changed. If you use a partial range, label it, and use the same rule every time you compare snapshots.
Can an Option Chain Suggest Support or Resistance?
Traders often look at OI by strike alongside the PCR. In the six-strike sample, 24,800 has the highest put OI at 68,000 contracts. The 25,000 strike has the highest call OI at 66,000 contracts. Some traders watch such strikes as possible concentrations of positioning, and some call them support or resistance candidates.
Treat that as a prompt to look further, not a conclusion. OI does not show whether positions are long or short, whether a hedge is involved, or whether a level will hold. Concentrations can shift quickly, especially close to expiry. Check price action, changes in OI, liquidity and your own risk plan before reading anything into a strike.
How Do You Use PCR More Responsibly? A Four-Step Workflow
Use PCR as one input in a written process, never as a stand-alone signal.
- Define the dataset. Record the underlying, expiry, observation time, strikes used, and whether the figure is OI PCR or volume PCR. The paper trading journal guide shows what is worth writing down.
- Check the baseline. Compare with earlier values calculated the same way. A move from 1.01 to 1.06 is a different observation from a single 1.06 reading.
- Add context. Look at the index trend, changes in OI, volume, liquidity, volatility and the days left to expiry. Keep evidence separate from speculation. Liquidity matters because wide quotes make options costly to trade, and the bid, ask and LTP guide explains how to read them.
- Do not trade on PCR alone. Decide position size, the most you accept losing and the conditions that cancel the idea before you act. The swing trading risk management guide covers those basics.
For illustration, suppose a later snapshot of the same six strikes shows 281,000 put OI and 266,000 call OI. The OI PCR is 281,000 ÷ 266,000 = 1.0564, about 1.06. You can say the ratio rose from about 1.01 to about 1.06. You cannot say that rise alone forecasts a reversal.
If you want to practise reading option chains without risking money, the options paper trading guide is a place to start.
What Are the Common PCR Mistakes?
Most PCR errors come from mixing measures or reading too much into one number.
- Mixing OI PCR and volume PCR. They use different totals and can give different readings, as the example showed (1.01 against 0.88).
- Calling a partial sample the full-expiry PCR. Leaving out strikes can change the answer, as the three-way table showed.
- Treating put OI as put buying. OI counts open contracts. It does not show who started them.
- Using fixed levels. A reading of 1.20 can be unusual in one dataset and ordinary in another.
- Ignoring expiry and timestamp. Comparing snapshots from different contract sets or times can create false trends.
- Ignoring hedges and structures. Protective puts, short puts, covered calls and spreads change what the totals mean.
- Confusing PCR with max pain. PCR compares put and call totals. Max pain is a separate concept based on expiry payoffs.
Final Thought
- PCR is puts divided by calls. Calculate it from open interest or from volume, and say which.
- The hypothetical six-strike chain gave an OI PCR of about 1.01 and a volume PCR of about 0.88. They differ because they measure different things.
- The strike range changes the answer. The same chain gave 0.79, 1.01 and 1.08 for three different ranges.
- No single level predicts price. Compare with the ratio's own history and use it as context, not an instruction.