
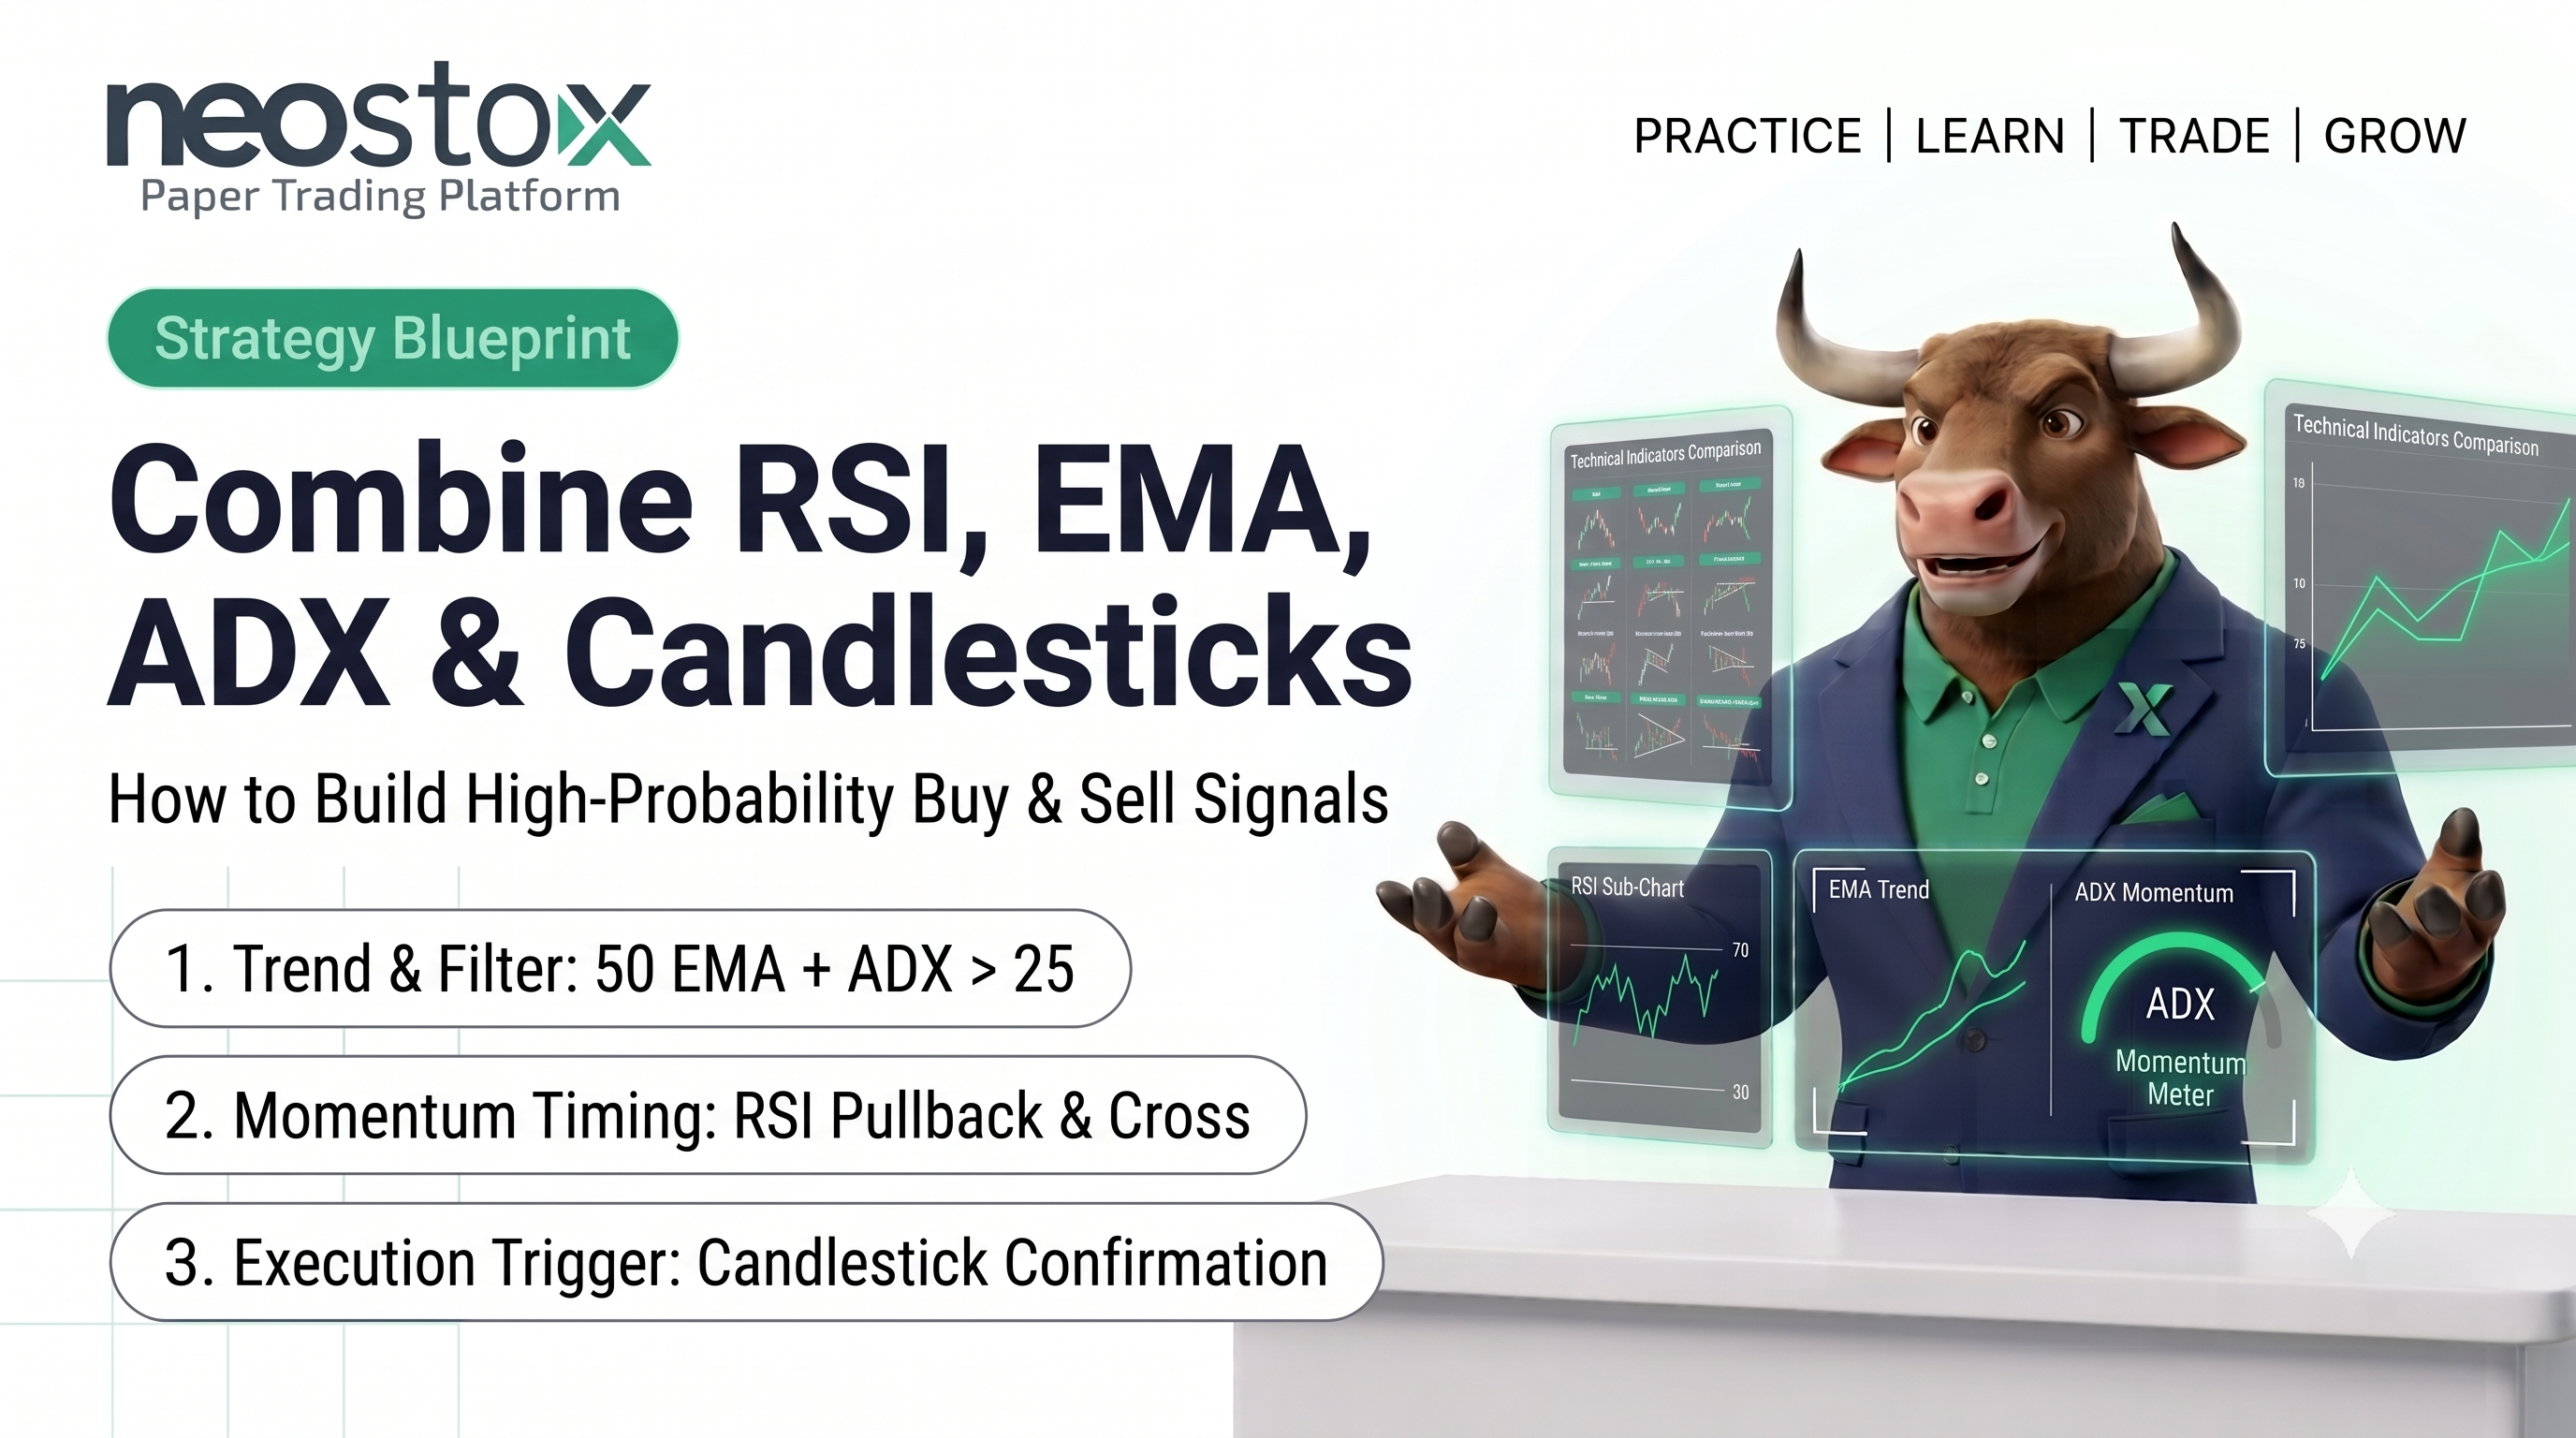
No single indicator should trigger a trade on its own. A workable framework stacks four layers that each answer a different question. EMA shows the direction. ADX confirms whether a real trend backs that direction. RSI times the momentum within it. A candlestick pattern confirms the actual entry. When all four line up, you've got real confluence. When they disagree, that disagreement is useful information too, it usually means wait.
Why combine indicators at all?
One indicator, used alone, leaves a gap. RSI without trend context can flag "oversold" deep into a strong downtrend, right before price keeps falling anyway. EMA without momentum confirmation can show a clean trend that's already running out of steam. Every single indicator answers one question well and stays blind to everything else.
Confluence means stacking tools that answer different questions, so each one covers a blind spot the others have. It doesn't eliminate false signals. Nothing does. It reduces how often you're acting on just one narrow, incomplete read of the market.
The four roles in this framework
Give each tool one job. Don't ask any of them to do more than that.
- EMA (Exponential Moving Average) sets direction. Price above a rising EMA leans bullish. Price below a falling EMA leans bearish. This is your filter for which direction you're even allowed to trade.
- ADX confirms trend strength. A rising ADX above roughly 25 suggests a real trend is in play, not just noise. A low or falling ADX suggests a ranging market, where trend-following signals deserve less weight.
- RSI times the momentum. Within whatever direction EMA and ADX have already confirmed, RSI shows whether momentum currently favors entering now, or waiting.
- Candlestick patterns confirm the actual entry trigger. A specific, confirmed candle, not an anticipated one, marking the moment you act rather than just watch.
Four tools. Four separate jobs. None of them substitutes for the others.
How do EMA, RSI and candlestick patterns produce a buy or sell signal?
Walk through a bullish example. Price sits above a rising 50-period EMA. Direction confirmed. RSI pulls back toward 40 to 50 during a minor dip, not deeply oversold, just a pause within an uptrend. Then it turns back up. That's the momentum cue.
Now wait for candlestick confirmation. A bullish engulfing candle. A hammer at a pullback low, closing in your favor. That candle closing is the actual trigger. Not the RSI turn alone. Not the EMA alignment alone. The combination.
A bearish setup mirrors this exactly. Price below a falling EMA. RSI bouncing toward 50 to 60 during a minor relief rally, then turning back down. A bearish candlestick, an evening star, a bearish engulfing pattern, confirming at that turn. Entry triggers on the candle's close, not before.
How can ADX confirm RSI and EMA?
ADX acts as a filter sitting above the other two. Before trusting an EMA-and-RSI signal at all, check ADX first. A rising ADX above roughly 25 says a real trend sits behind the EMA's direction. That means the RSI and candlestick signals built on top of it deserve real weight.
A low or falling ADX, often below 20, says the opposite. Price might be chopping sideways rather than trending. EMA direction in that condition gets far less reliable. RSI in a low-ADX, range-bound market works differently too, better for spotting swings between boundaries than riding a sustained move. Check ADX first. It tells you which kind of market you're actually in, before you lean on the other two tools at all.
How should candlesticks confirm an indicator signal?
Indicators lag by nature. They're calculated from price that's already happened. A candlestick confirmation adds a final, present-moment check before you actually commit capital.
Wait for the candle to close before acting. Not partway through its formation. An unconfirmed, still-forming candle can reverse completely before the session ends. Match the candlestick to the signal's direction, a bullish reversal candle for a long entry, a bearish one for a short. Check that volume supports it too. A confirmation candle on unusually light volume carries less weight than one backed by real participation.
Handling conflicting signals
This happens constantly, and it's worth having a plan for it rather than improvising in the moment. EMA says bullish. RSI looks weak. ADX is low. None of that agrees.
When signals conflict, the simplest, most defensible response is usually to do nothing. Wait for better alignment rather than forcing a trade out of partial agreement. Some traders reduce position size instead of skipping the trade entirely, treating a mixed-signal setup as lower conviction rather than no conviction. Either approach beats overriding disagreement and trading anyway because you've already decided a move is "supposed" to happen. Conflicting signals are information. Acting on a wish, not information, is how discipline erodes fastest.
Which technical alerts should day traders set?
A few practical ones, tied directly to the framework above, worth setting on your charting platform rather than watching manually all session.
- RSI threshold alerts, commonly at 70 and 30, or a tighter 80 and 20 band, flagging when RSI crosses into or out of overbought or oversold territory.
- EMA crossover alerts, when price crosses a key EMA, or when a faster EMA crosses a slower one, flagging a potential shift in direction worth checking.
- ADX threshold alerts, commonly around 25, flagging when a market transitions from ranging into a developing trend, or the reverse.
- Volume spike alerts, flagging unusual activity that might accompany a genuine breakout versus a low-conviction move.
None of these alerts should trigger an automatic trade on their own. Treat each one as a prompt to go check the full framework, EMA direction, ADX strength, RSI momentum, candlestick confirmation, not a standalone buy or sell command.
Confluence framework at a glance
| Layer | Tool | Question it answers | Role |
|---|---|---|---|
| 1 | EMA | Which direction? | Sets the allowed trade direction |
| 2 | ADX | Is there a real trend? | Filters whether to trust the setup |
| 3 | RSI | Is momentum favorable right now? | Times when to look for entry |
| 4 | Candlestick | Has price actually confirmed? | Triggers the entry itself |
Reading about confluence is one thing. Watching EMA, ADX, RSI, and candlestick confirmation actually line up, or disagree, on a live chart teaches the pattern faster than any written example. Neostox's charting tools display all four together across equities, futures, and options on live NSE and BSE market conditions, and paper trading lets you practice this full framework with virtual money before any of it touches real capital.