
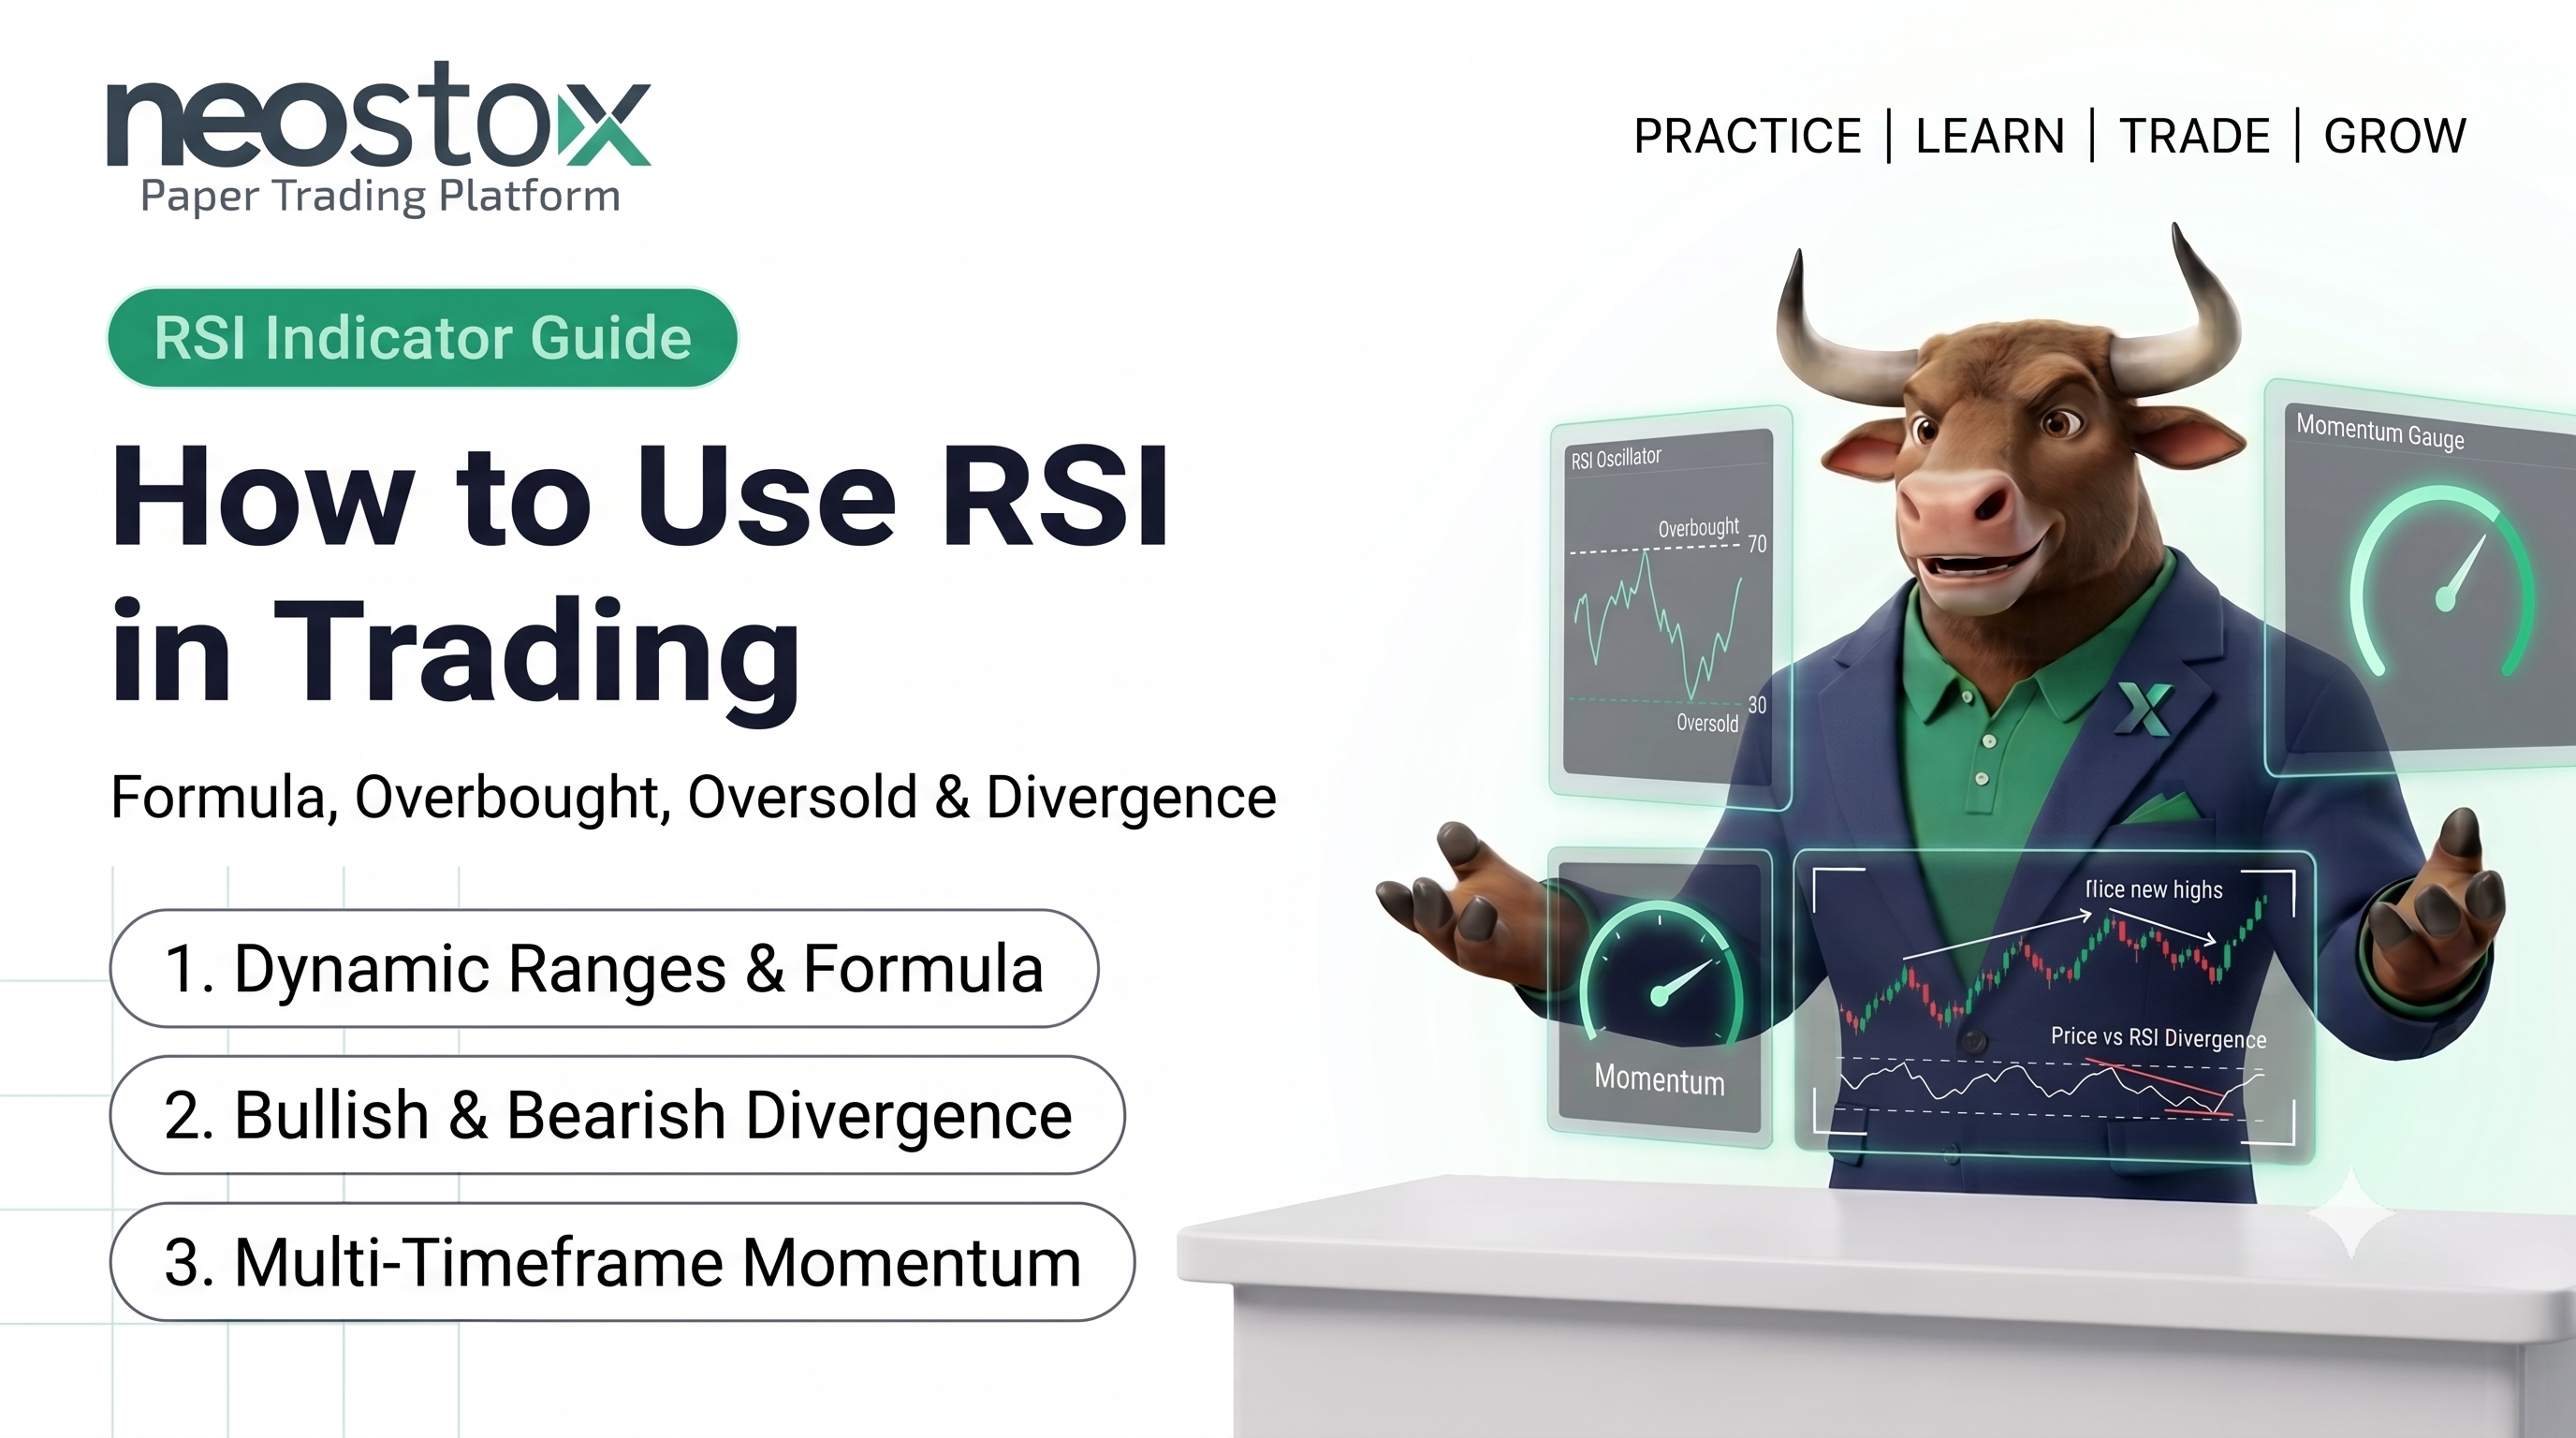
RSI measures how fast and how far price has moved lately. It sits on a 0 to 100 scale. Above 70 gets called overbought. Below 30, oversold. Neither means a reversal is coming. RSI can sit at an extreme for weeks if a trend has real strength behind it. Divergence, where price and RSI stop agreeing, works better as an early warning than a trade trigger. And RSI looks different depending on which timeframe you're watching.
So what is RSI, really?
J. Welles Wilder built RSI and introduced it in a 1978 book on trading systems. Almost fifty years later, people still use it constantly. Why? It's easy to read once you get the logic.
It's a momentum oscillator. Not a price tool. It tracks speed, not level. You won't see rupees on an RSI line. Just a number from 0 to 100. It climbs when recent gains outpace recent losses. It falls when losses take over.
The formula (and why bother learning it)
RSI = 100 minus 100 divided by (1 plus RS). RS stands for Relative Strength. Take the average gain over a set period. Divide it by the average loss over that same stretch. Fourteen periods is standard. Plenty of traders tweak that number.
Nobody calculates this by hand anymore. Your charting platform does it the second you add the indicator. So why bother with the formula at all? Because it explains the behavior. A stock posting mostly gains, with small, rare losses, gets pushed toward the high end almost automatically. Once you see that, RSI stops feeling like a black box.
Overbought and oversold: what the labels really mean
Convention says 70 is overbought. Thirty is oversold. Some traders tighten that to 80 and 20, especially for anything more volatile than a typical large-cap. None of this is a law of physics. It's just a shared reference point.
Here's where beginners trip up. Overbought doesn't mean "sell now, crash incoming." It just means momentum has stayed positive for a while. A stock in a real uptrend can sit above 70 for weeks straight. Traders who short the moment RSI crosses that line, betting gravity has to win, learn this lesson the hard way more often than not. Strong trends don't check the textbook first.
RSI divergence, in plain English
Divergence shows up when price and RSI disagree. Two kinds.
- Bullish divergence: Price prints a lower low. RSI prints a higher low at the same time. Price keeps falling, but the selling pressure behind it is actually fading. Some traders read that as an early sign the decline is running out of gas.
- Bearish divergence: The mirror image. Price hits a higher high. RSI hits a lower high. The rally looks fine on the surface. Underneath, momentum is losing steam.
One honest note here. Divergence isn't a stopwatch. It doesn't tell you when, or even guarantee a reversal happens at all. Plenty of divergences just fizzle into a pause, not a turn. Treat it as a signal to pay closer attention. Not a green light to act.
Does RSI at 89 mean a stock has to fall?
No. This might be the single most common RSI mistake out there. An RSI of 89 tells you momentum has been extremely strong. That's it. It doesn't forecast tomorrow.
Stocks have run for weeks with RSI pinned near 90 the entire time. A strong earnings cycle. A sector-wide rally. Sometimes a short squeeze that just kept squeezing. A high reading describes right now. It isn't a prediction. If you're going to act on an extreme RSI reading, pair it with trend context and real price structure first. Don't trade the number alone.
Which timeframe and period should you actually use?
Two different dials. Keep them separate in your head.
The period controls how far back RSI looks. Fourteen is standard. Nine and twenty-one show up often too. Shorten it, and RSI reacts fast, throwing off more signals and more noise with them. Lengthen it, and the line smooths out. Slower, but cleaner.
The chart timeframe is a separate question. A 5-minute chart, an hourly, a daily, they're not interchangeable. RSI on a 5-minute chart reacts to momentum over minutes. RSI on a daily chart reflects weeks of price action. The same stock can show overbought RSI on one timeframe and neutral RSI on another, at the exact same moment. Each one is genuinely measuring something different. There's no single "right" setting. It depends on how you trade. A companion guide on chart patterns by market and timeframe covers this same idea in more depth.
Intraday or swing and delivery: where does RSI work better?
Neither, honestly, not by any solid evidence. This page won't pretend otherwise. But the two do feel different in practice.
Intraday RSI moves fast. You'll see far more signals in a single session, and a good chunk will be noise. A quick burst of buying can push RSI to an extreme and back within minutes. Confirmation matters more here, not less.
Swing and delivery RSI, on daily or weekly charts, moves slower. Fewer signals. But each one carries real weight, built from a much broader stretch of price history.
Neither context makes RSI unreliable. They just need different handling. Faster confirmation and tighter risk control intraday. More patience and wider context on longer timeframes.
RSI quick reference
| Concept | What it means |
|---|---|
| Scale | 0 to 100 |
| Standard period | 14 (shorter reacts faster with more noise; longer reacts slower and smoother) |
| Overbought convention | Above 70, or 80 on a stricter band |
| Oversold convention | Below 30, or 20 on a stricter band |
| Bullish divergence | Price makes a lower low; RSI makes a higher low |
| Bearish divergence | Price makes a higher high; RSI makes a lower high |
| High RSI meaning | Strong recent momentum, not a guaranteed reversal |
Reading about RSI only takes you so far. Watching it move on a live chart, reacting in real time, teaches you things no explanation can. Neostox's charting tools display RSI and other indicators across equities, futures, and options on live NSE and BSE market conditions. Paper trading lets you test your own reads of it with virtual money, well before real capital enters the picture.