
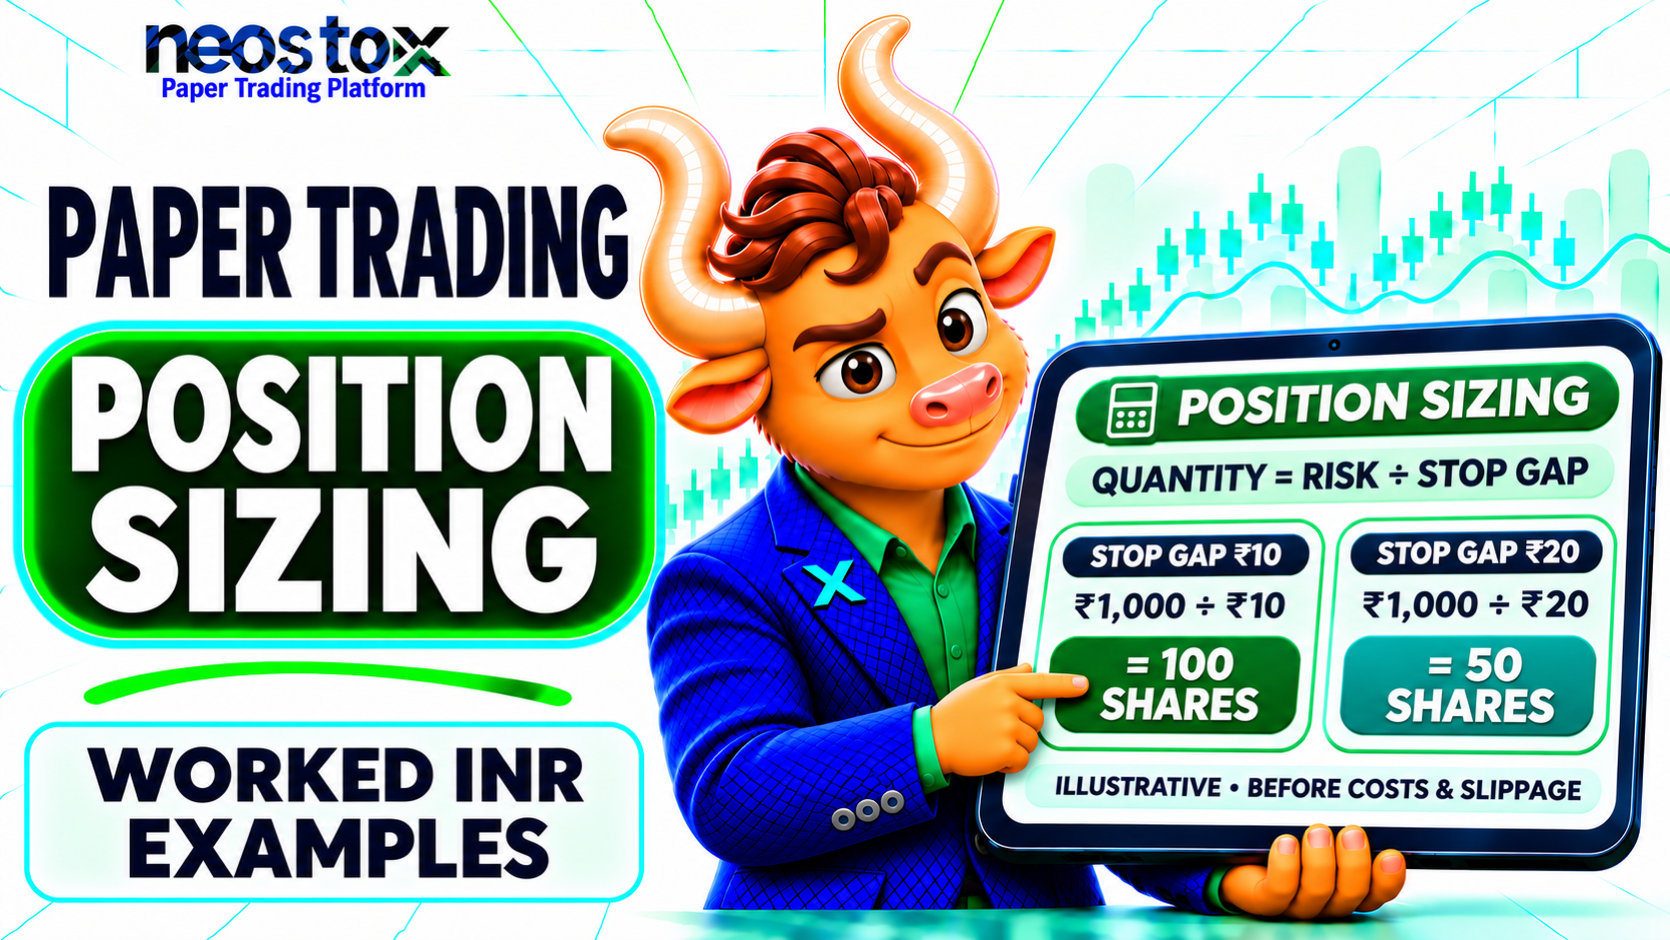
Paper Trading Position Size Calculator (Excel Worksheet)
The worksheet has three tabs. Calculator sizes one trade. Portfolio adds up the planned risk of several open trades. Tests lists 18 cases with expected results, so you can check the maths yourself. Type into the yellow cells. The blue cells calculate.
Read the Input check cell first. Results appear only when it says OK. It blocks a zero stop distance, a stop on the wrong side of the entry, a zero balance and a missing lot size.
Download the position size calculator (.xlsx)
Equity / Intraday Position Calculator
Choose "Equity shares" and enter:
- Virtual capital and planned risk %
- Exposure cap %, the most position value you allow in one trade
- Long or Short, entry price and stop price
It returns risk-only shares, cap-only shares, the final quantity, position value, planned stop risk, unused risk budget and the binding constraint. Quantities are whole shares, rounded down.
F&O Lot Size Calculator
Choose "F&O lots" and type the lot size. The worksheet ships with no lot size, because exchange lot sizes are revised. Look up the current value for your contract in the exchange's contract file and enter it. The worksheet then rounds the permitted quantity down to whole lots. If one lot is too big, it shows no permissible lot and names the limit that failed. It does not calculate margin.
What Is Position Sizing in Paper Trading?
Position sizing in paper trading means choosing how many shares or lots to buy or sell in a simulated trade, so that a stop at its planned price costs about the risk budget you set beforehand. It uses virtual capital, so no real money is at stake. The aim is to build the habit before real money is involved.
A paper order is not a real order, but a careless size can still teach a careless habit. Sizing also keeps results comparable. If every trade risks a similar amount, a winner and a loser can be compared fairly, whatever the share price. A planned loss is also not the same as the loss you record at the end. Realised vs unrealised P&L explains how open and closed results differ.
Paper Trading Position Size Formula
For a cash-equity paper trade, first calculate planned risk as virtual capital multiplied by the selected risk percentage. Divide that rupee amount by the absolute difference between entry and stop-loss prices to get risk-sized shares. Round down, then apply the virtual cash or exposure cap. For F&O, apply whole-contract lots and separate margin assumptions.
Planned risk = virtual capital × risk %
Stop distance = |entry − stop|
Risk-only units = floor(planned risk ÷ stop distance)
Cap-only units = floor((capital × exposure cap %) ÷ entry)
Permitted units = the smaller of the two
Final quantity = permitted units (equity)
 = lot size × floor(permitted units ÷ lot size) (F&O)
Risk Budget and Risk per Unit
| Variable | Meaning | Example |
|---|---|---|
| Virtual capital | The balance you treat as your account | ₹1,00,000 |
| Risk % | Share of capital you plan to lose if the stop fills | 1% |
| Planned risk | Capital × risk % | ₹1,000 |
| Stop distance | Gap between entry and stop, in ₹ per unit | ₹10 |
| Risk-only units | Planned risk ÷ stop distance, rounded down | 100 |
For a long trade the stop sits below the entry. For a short trade it sits above. If the stop equals the entry, the distance is zero and the formula breaks, so the worksheet refuses to calculate.
Apply Capital and Lot Caps
A risk-based quantity can be larger than you can or should hold. A tight stop makes the risk-based figure grow quickly. So a second limit caps the value of the position, and the final quantity is the smaller of the two. In F&O mode there is a third step: round down to whole lots. Exposure here means position value, which is different from stop risk. A later section explains the difference.
How to Use the Calculator (5 Steps)
- Set your balance and risk budget. Type virtual capital and a risk percentage.
- Set an exposure cap. Type the largest position value you allow, as a percentage of capital.
- Choose the instrument and side. Pick Equity shares or F&O lots, then Long or Short.
- Enter entry and stop. In F&O mode, also type the current lot size.
- Read the result and check it. Confirm the Input check says OK, read the final quantity, and note the binding constraint.
Set Virtual Balance and Risk Budget
Type the balance you want to treat as your account. Your platform may give you a fixed amount that is larger than you would really trade. If so, type your own working balance and size trades against it. The Neostox FAQ says you can enter a fixed investment amount or a percentage of your available virtual capital, which fits this idea. The 1% in the examples is a sample, not a safe level for everyone.
Enter Trade and Validate Outputs
Enter your planned entry and stop, then read the results. Check them by hand once. Planned risk should equal quantity × stop distance. Position value should not exceed your cap. Then use the final quantity on your simulator's order ticket. If your simulator has stop-loss fields, enter the same stop price. The same FAQ says targets and stop-losses can be entered as a fixed price or a percentage. How to place them on your own platform is covered in how to practice stop loss in paper trading.
Worked Example: ₹1,00,000 Paper Account
With ₹1,00,000 of virtual capital, a 1% planned risk budget is ₹1,000. At a ₹250 entry and ₹240 stop, the risk-based quantity is 100 shares. If your paper-trading rule limits exposure to ₹15,000, only 60 shares fit. The planned stop risk becomes ₹600 before assumed costs and slippage.
| Input | Value |
|---|---|
| Virtual capital | ₹1,00,000 |
| Planned risk | 1% = ₹1,000 |
| Entry (long) | ₹250 |
| Stop | ₹240 |
| Exposure cap | 15% = ₹15,000 |
Compute Shares From the Stop
The stop distance is |₹250 − ₹240| = ₹10. Risk-only units are ₹1,000 ÷ ₹10 = 100 shares. At this point nothing has checked whether you can afford them. 100 shares at ₹250 would be ₹25,000, which is 25% of the account.
Limit the Trade by Exposure
The cap allows ₹15,000. Cap-only units are floor(₹15,000 ÷ ₹250) = 60 shares. The final quantity is the smaller of 100 and 60, which is 60.
| Result | Calculation | Value |
|---|---|---|
| Final quantity | min(100, 60) | 60 shares |
| Position value | 60 × ₹250 | ₹15,000 (15% of capital) |
| Planned stop risk | 60 × ₹10 | ₹600 (0.6% of capital) |
| Unused risk budget | ₹1,000 − ₹600 | ₹400 |
| Binding constraint | Smaller limit | Exposure cap |
The final risk is below the budget because the cap decided the size, not the stop. With a 30% cap, 120 shares would fit, so the risk budget would decide: 100 shares, ₹25,000 of value and ₹1,000 of planned risk.
A short trade works the same way. With a ₹250 entry and ₹258 stop, the distance is ₹8. Risk-only units are 125, the cap allows 60, and planned risk on 60 shares is ₹480.
If the balance changes, the result changes. With the same percentages, a ₹2,00,000 balance gives 120 shares and a ₹50,000 balance gives 30. Both limits scale with the balance, so the quantity scales too.
NIFTY and Bank Nifty Lot-Based Sizing
Indian derivatives generally trade in whole exchange-defined contract lots. A paper-trading calculator must therefore round its permissible quantity down to a multiple of the current lot size. It should check the relevant contract first, and show "no permissible trade" if one whole lot breaks your chosen risk or funding rules.
Never copy a lot size from an old article or screenshot. Lot sizes are set by the exchange and revised from time to time. Use the current contract file and note the date you checked it. The lot size below is made up for arithmetic.
Round Risk-Sized Quantity Down to Lots
Final units = lot size × floor(permitted units ÷ lot size).
Take a hypothetical lot size of 50 units. You buy an option at a premium of ₹120 with a stop at ₹110, using ₹1,00,000 of capital, a 1.2% risk budget and a 15% exposure cap.
| Step | Calculation | Result |
|---|---|---|
| Planned risk | ₹1,00,000 × 1.2% | ₹1,200 |
| Risk-only units | ₹1,200 ÷ ₹10 | 120 |
| Cap-only units | floor(₹15,000 ÷ ₹120) | 125 |
| Permitted units | min(120, 125) | 120 |
| Whole lots | floor(120 ÷ 50) | 2 lots = 100 units |
| Premium outlay | 100 × ₹120 | ₹12,000 |
| Planned stop risk | 100 × ₹10 | ₹1,000 |
The ₹120 premium, ₹110 stop and lot size of 50 are for arithmetic only. They are not NIFTY or Bank Nifty prices or lot sizes.
What If One Lot Exceeds Your Risk Limit?
Keep the same hypothetical lot of 50 and the ₹120 premium, but set the stop at ₹100 and the risk budget at 0.5%. The budget is ₹500. The risk-only quantity is ₹500 ÷ ₹20 = 25 units, which is below one lot. One lot would risk 50 × ₹20 = ₹1,000, twice the budget. The answer is zero lots.
You then have honest choices: skip the trade, find a contract that fits, or use a tighter stop only if your analysis supports it. Raising the risk budget just to make the trade fit defeats the purpose of sizing.
Planned Risk vs Capital Exposure
Planned risk and capital exposure answer different questions. Position value is the cash or notional amount deployed. Planned risk estimates the change in P&L if the stop fills at its price, before other execution factors. Margin is something else again: a deposit your broker or platform may require.
| Measure | What it tells you | In the ₹1 lakh example |
|---|---|---|
| Position value | How much is deployed | ₹15,000 |
| Planned stop risk | Estimated loss at the stop | ₹600 |
| Margin | A required deposit | Not calculated by the worksheet |
A large position with a tight stop can risk less than a small position with a wide stop. 100 shares at ₹250 with a stop at ₹249 hold ₹25,000 but plan to lose ₹100. 20 shares at ₹250 with a stop at ₹225 hold ₹5,000 but plan to lose ₹500. That is why a position-value cap and a risk budget work as a pair.
Margin, Costs and Simulated Execution
The worksheet keeps its assumptions simple and visible. Your simulator may differ, so check how it works before you compare results.
| Item | In this worksheet | What to check on your platform |
|---|---|---|
| Stop fill | At the stop price | Whether it models gaps and slippage |
| Costs | Not included | Whether brokerage, fees and taxes are simulated |
| Margin | Not modelled | Whether and how it is simulated |
| Lot size | You type it | The current exchange value |
| Prices | You type them | The data and delay on your platform |
The Neostox FAQ says its reports include simulated brokerage, fees and taxes, so compare your cost assumption with what your platform reports. How intraday trading charges work shows the categories for real trades.
Stocks, Options and Futures Differ
| Cash equity (long) | Bought option | Futures, sold options, short positions | |
|---|---|---|---|
| What you pay or deposit | The full price | The premium | A margin deposit |
| Loss profile | Up to the amount invested | At most the premium paid | Can exceed the margin deposited |
| Worksheet support | Full | Whole lots, premium stop | Lot rounding only; margin and loss profile not modelled |
For options and futures, quantity, premium outlay, notional value, margin and scenario loss are different numbers. A stop-distance calculation cannot replace margin models or capture every option risk. See options paper trading for how practice options behave.
Why a Stop Cannot Guarantee the Loss
A position size calculator estimates planned loss from the entry-to-stop price difference; it does not guarantee that a position closes at the stop. Price gaps, slippage, liquidity and execution rules can produce a different exit. A paper-trading simulator should disclose which of these factors it models and whether costs are included in the shown risk.
Take the 60-share example with a ₹240 stop. If the next price gaps down and the position exits at ₹232, the loss is 60 × ₹18 = ₹1,080. The plan said ₹600, so the result is 1.8 times the plan. This is hypothetical. Stop-loss market vs stop-loss limit shows what each order type does after the trigger, and bid, ask and LTP explains why a fill can differ from the screen price.
Portfolio Heat and Multiple Paper Trades
Each trade's planned risk is small, but open trades add up. The Portfolio tab sums them. Take three paper trades on ₹1,00,000: two bank shares with planned risks of ₹600 and ₹400, and one IT share with ₹300. The sum is ₹1,300, or 1.3% of capital. Their position values add to ₹36,000.
The two bank shares share a theme, so a sector-wide fall could hit both stops together. That is ₹1,000 of planned risk on one idea. The sum is a planning figure, not a guaranteed worst case. Stops can fill worse than planned, and related positions can move together in ways a sum does not capture. Swing trading risk management covers position sizing and overnight risk across several trades.
Common Sizing Errors to Avoid
- Stop on the wrong side. A long stop above the entry gives a nonsense distance. Check the side first.
- Rounding up. Always round shares and lots down. Rounding up breaks the limit you just set.
- Treating planned risk as a cap on loss. It is a plan, not a guarantee. Gaps and slippage can exceed it.
- Using a stale lot size. Check the current exchange contract file, and note the date.
- Widening the stop to fit more shares. Let the stop come from the setup, then let sizing follow it.
- Ignoring costs. Planned risk excludes costs. Leave room for them.