
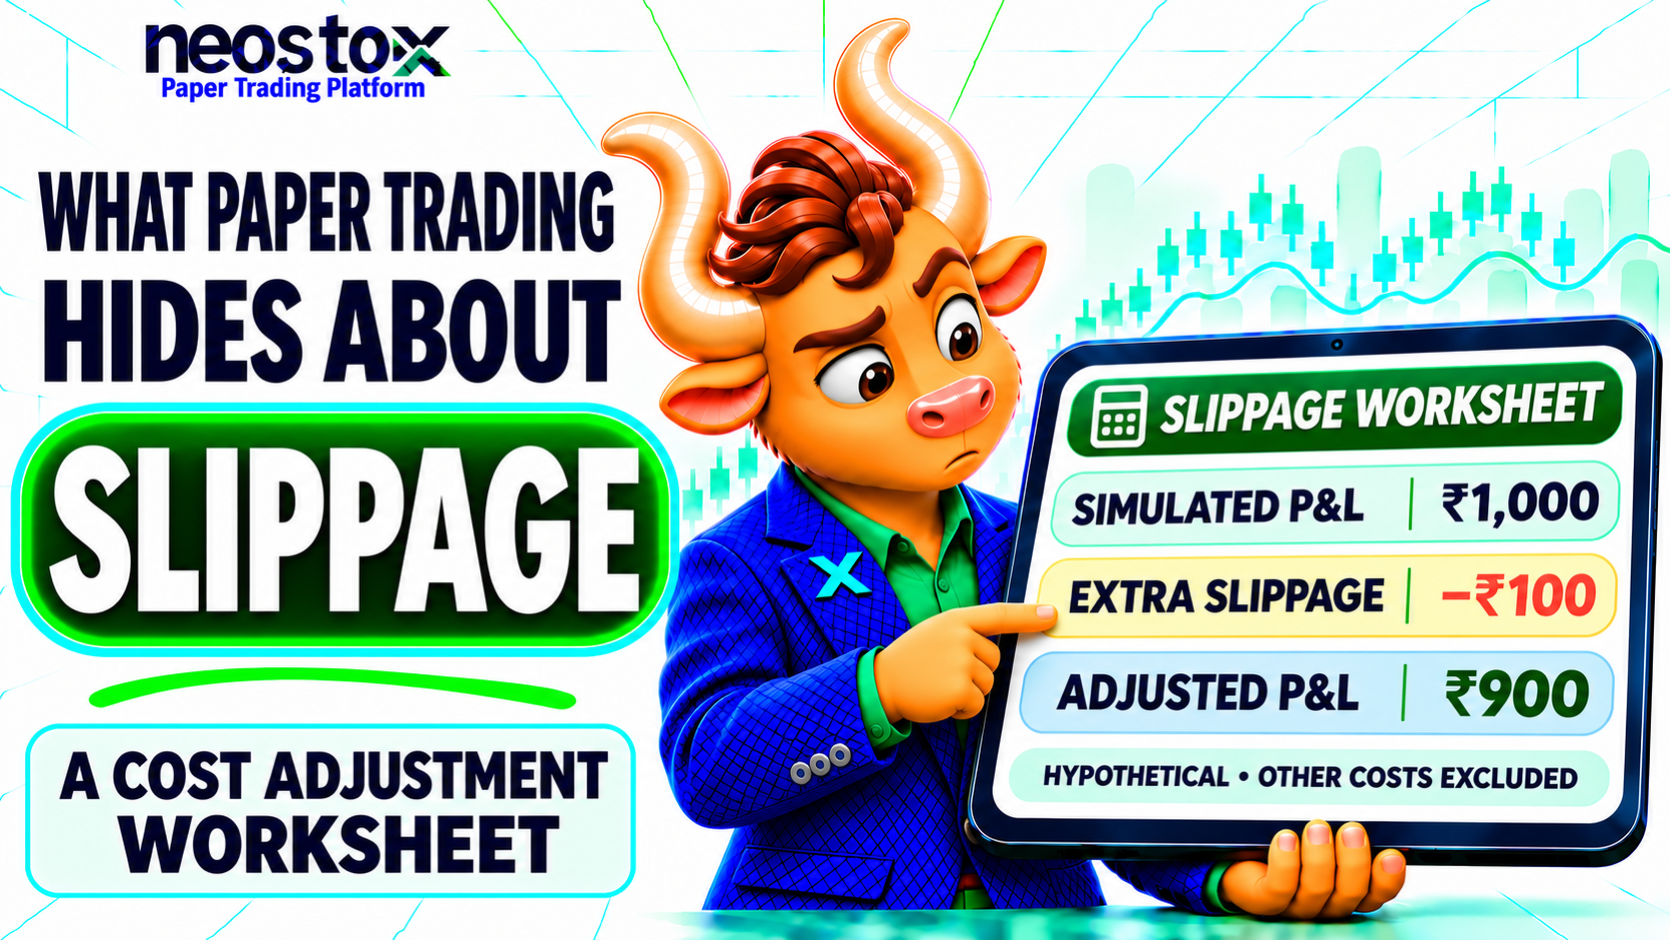
The number depends on the benchmark you pick, so this guide fixes one convention and sticks to it. Jump to the formula, the estimation methods or the ways to reduce it. All rupee amounts are hypothetical illustrations, not recommendations.
What Is Slippage in Trading?
Slippage is the gap between the price you expected and the price your order actually received. "Expected" means a benchmark you choose in advance, such as the best quoted ask, the midpoint of bid and ask, or a trigger price. The gap can cost you or help you, and it can differ on every order.
It is an execution result, not a fee. Brokerage and the bid-ask spread are separate costs. The bid, ask and LTP guide explains the quotes you compare against.
| Order | Reference | Fill | Result |
|---|---|---|---|
| Buy | ₹100.00 | ₹100.10 | Adverse: you paid more |
| Buy | ₹100.00 | ₹99.95 | Favourable: you paid less |
| Sell | ₹100.00 | ₹99.90 | Adverse: you received less |
| Sell | ₹100.00 | ₹100.05 | Favourable: you received more |
Positive vs. Negative Slippage
Many traders call a better fill "positive slippage", but journals and tools differ, and some record cost as a positive number. This guide says adverse and favourable. In the formulas below, a positive number is a cost and a negative number is a favourable fill. Write your convention at the top of your journal.
How Do You Calculate Slippage?
Choose a benchmark first, then subtract. For a buy, adverse slippage per unit is the fill price minus the reference price. For a sell, it is the reference price minus the fill price. Multiply by quantity for rupees, or divide by the reference price and multiply by 10,000 for basis points.
The benchmark changes the answer. The best ask, the midpoint and a trigger price each answer a different question. Against the midpoint, a shortfall includes part of the bid-ask spread as well as later price movement.
Buy and Sell Formulas
Buy adverse slippage per unit = fill price − reference price
Sell adverse slippage per unit = reference price − fill price
Cash amount = slippage per unit × quantity × contract multiplier
Basis points = slippage per unit ÷ reference price × 10,000
A negative result is a more favourable fill. For orders filled in parts, use the average fill price, weighted by quantity, rather than the last fill.
Cost in Rupees, Points or Basis Points
Rupees tell you what a fill cost. Basis points (one basis point is 0.01%) let you compare orders at different prices. For derivatives, the quantity is units, which is lots multiplied by lot size. For example, with a hypothetical lot size of 50, two lots are 100 units, and an adverse move of ₹0.50 costs ₹50.
| Field | Value | Working |
|---|---|---|
| Reference ask | ₹200.00 | Chosen benchmark |
| Average fill (buy) | ₹200.10 | Weighted average |
| Quantity | 300 shares | Multiplier 1 |
| Adverse slippage | ₹0.10 per share | 200.10 − 200.00 |
| Cost and basis points | ₹30 and 5.0 bps | 0.10 × 300; 0.10 ÷ 200 × 10,000 |
Slippage Cost: Two Worked Examples
Both examples follow one hypothetical trade, from quote to fill to risk budget, and later into the journal.
- A paper account of ₹1,00,000, risking 1% (₹1,000) per trade.
- A buy-stop breakout entry with a trigger at ₹250.00 and a stop-loss at ₹245.00. Planned risk is ₹5.00 per share, so the plan buys 200 shares.
- When the entry triggers, the best bid is ₹249.85 and the best ask is ₹250.05.
- The entry fills at an average of ₹250.20.
- Later, the stop-loss triggers at ₹245.00 and fills at ₹244.40 after a gap. Brokerage, taxes and other charges are ignored.
Stock Buy Order
The same fill gives three different slippage figures, depending on the benchmark.
| Benchmark | Reference | Slippage per share | Cost on 200 shares | Basis points |
|---|---|---|---|---|
| Best ask at decision | ₹250.05 | ₹0.15 | ₹30 | 6.0 |
| Midpoint of bid and ask | ₹249.95 | ₹0.25 | ₹50 | 10.0 |
| Trigger price | ₹250.00 | ₹0.20 | ₹40 | 8.0 |
The spread is ₹0.20, so half of it is ₹0.10, and the midpoint figure is the ask figure plus that half-spread: ₹0.15 + ₹0.10 = ₹0.25. None of the three is wrong, but they measure different things, so never mix them in one average. The rest of this guide uses the trigger price, because it is the price in the plan.
Stop-Loss / Gap Scenario
A standard stop order generally becomes a market order once the trigger price is reached. In a fast or gapping market, the fill can land well below the trigger.
| Item | Per share | On 200 shares |
|---|---|---|
| Planned loss (₹250.00 to ₹245.00) | ₹5.00 | ₹1,000 |
| Entry slippage against the trigger | ₹0.20 | ₹40 |
| Exit slippage (stop ₹245.00, fill ₹244.40) | ₹0.60 | ₹120 |
| Actual loss | ₹5.80 | ₹1,160 |
The loss is 1.16 times the plan, and ₹160 of it is slippage. Sizing from the stop distance alone does not see this cost. The stop-loss practice guide shows how to rehearse the order itself.
Daily limits feel the same gap. Two such trades, each planned at ₹1,000, total ₹2,000, which equals a 2% daily limit on ₹1,00,000. Actual losses of ₹2,320 would breach it by ₹320. That is how slippage connects to the paper trading daily loss limit rule.
How to Estimate Slippage in Paper Trading
To estimate slippage in paper trading, record a reference price before each order, compare it with the simulated fill, and total the differences in rupees and basis points. Because a simulator may not model your order's effect on the market, also test extra allowances, such as half the spread, against your results.
A paper account has no live order to inspect, so build the estimate from more than one angle.
| Method | What you do | Best for | Limit |
|---|---|---|---|
| Observed paper fills | Note the bid, ask and trigger before each order, then compare with the fill | Your own trade log | Only as realistic as the simulator's fill rule |
| Spread estimate | A market buy at the ask and a market sell at the bid costs about one full spread per round trip against the midpoint | A quick floor for market orders | Ignores order size and fast markets |
| Size against displayed depth | Compare your quantity with the quantity shown at the best quote | Spotting orders that may walk the book | Paper orders usually do not move the book |
| Small live test orders | If you also trade live, record fills on a few minimum-size orders | Real execution evidence | Uses real money and real charges |
| Volatility proxy | Use a recent average true range (ATR) to size a stress allowance | Setting a what-if range | ATR measures price movement, not slippage |
For the spread method, a ₹0.20 spread on 200 shares is about ₹40 per round trip. Treat that as a minimum for market orders, not a forecast.
Convert what you learn into an allowance, in rupees per unit or basis points per side, and test it as shown in the backtesting section. Check your platform's help pages for how it decides fill prices. A simulator that fills near the last traded price shows little slippage by design, which says nothing about live execution.
What Causes Slippage?
Slippage occurs when the price you could see is not the price you could trade at. The book may have moved, too little quantity may sit at the best price, or your order may have arrived late.
| Cause | Mechanism | Mitigation |
|---|---|---|
| Fast volatility | Quotes move between decision and execution | Smaller size; avoid market orders in rapid moves |
| News or events | Prices jump and spreads widen | Avoid fresh entries around scheduled announcements |
| Thin liquidity | Few orders near the best price | Trade more liquid instruments |
| Large order | Quantity exceeds the displayed size, so the fill walks the book | Cut size or split the order |
| Delay | The quote you saw is old when the order executes | Compare timestamps; allow a wider tolerance |
| Price gap | The market opens or jumps past your price | Expect gaps on overnight positions |
Volatility and News
In quick markets the best price can change faster than you can act. Announcements and news can also widen spreads, which raises the cost of a market order even when the price does not move far. Record the market condition beside each fill.
Liquidity, Size and Gaps
Liquidity is how much can be traded near the current price. A large order in a thin instrument can consume the displayed quantity and fill at progressively worse prices. A gap is different: the price skips levels, so a stop can sit in a range with no trades. The swing trading risk guide covers overnight exposure.
Which Order Types Can Slip?
Any order that can execute at a price other than the one you saw can slip. Market and stop orders favour getting filled over price. Limit orders favour price but may not fill. Rules differ by exchange and platform, so confirm how yours behaves.
| Order type | Price certainty | Fill certainty | Main slippage risk |
|---|---|---|---|
| Market | Low | High | Fills at whatever is available, so the spread and depth matter |
| Limit | High (at your price or better) | Not guaranteed | May not fill; you miss the trade |
| Stop (stop-market) | Low after the trigger | Generally high once triggered | Becomes a market order, so gaps can slip badly |
| Stop-limit | High after the trigger | Not guaranteed | May not fill, leaving the position unprotected |
Market vs. Limit
A market order prioritises getting filled. A limit order prioritises the price: it will not fill worse than your limit, but it may not fill at all, or only in part. A limit order does not guarantee a fill, and a missed trade is a cost too, so record non-fills in your journal.
Stop vs. Stop-Limit
A stop order waits for a trigger price, then generally becomes a market order. A stop-limit order becomes a limit order instead, which caps how bad the price can be but can leave the loss open if the market runs through the limit. The stop-loss market vs stop-loss limit guide compares them in more detail.
Slippage vs. Spread vs. Commission
These three costs overlap in practice, but they are not interchangeable. Spread is a feature of the quotes. Slippage is the gap between your reference and your fill. Charges are what the broker and the market add on top. Keep three columns in your journal.
| Spread | Slippage | Brokerage and charges | |
|---|---|---|---|
| What it is | Difference between best ask and best bid | Difference between your reference price and your fill | Fees and taxes on the trade |
| When it appears | Always, in the quotes | When an order executes | When an order executes |
| How to record | Ask − bid at decision | Fill vs a stated benchmark | Itemised in your report |
In the earlier example, the spread was ₹0.20, slippage against the ask was ₹0.15, and charges were set aside. The first two overlap against the midpoint, so state your benchmark before adding costs together. The intraday charges guide explains how charges are built up.
How to Reduce Slippage
You cannot remove slippage, but you can lower it and plan for what remains. Match the order type to the trade, check that the instrument is liquid enough for your size, and build a slippage budget into your risk plan. Every defence has a trade-off: price control can cost you the fill.
Before Sending an Order
- Choose the order type on purpose. A limit order controls price but may not fill. A market order fills but may cost more.
- Compare your size with the displayed quantity at the best quote.
- Prefer liquid instruments with a narrow spread.
- Add a slippage allowance to your plan. If planned risk is ₹1,000, decide what extra you accept, and size so the worst case stays within your limits.
- Write the benchmark down before you click, not afterwards.
During Volatile Sessions
- Reduce size when quotes are moving fast.
- Avoid fresh market orders around scheduled announcements, when spreads can widen.
- Accept non-fills. A missed limit order is often cheaper than a poor fill.
- Expect gaps overnight. A stop does not protect against a price that opens beyond it.
How to Measure Slippage in a Trading Journal
A journal turns a vague worry into a number you can track. Record the same fields for every order, calculate the difference with one stated convention, and review the totals weekly. A few dozen orders show a pattern; one order is an anecdote.
- Note the reference (bid, ask, midpoint or trigger) and its source before the order.
- Place the order and record its type and quantity.
- Record the average fill price, or mark the order as not filled.
- Calculate the slippage per unit, rupees and basis points with the formulas above.
- Review by order type and by market condition at the end of the week.
| Order | Symbol | Side | Type | Qty | Reference | Fill | Per unit | bps | Cash |
|---|---|---|---|---|---|---|---|---|---|
| 1 | ABC | Buy | Stop-market | 200 | ₹250.00 (trigger) | ₹250.20 | ₹0.20 | 8.0 | ₹40 |
| 2 | ABC | Sell | Stop-market | 200 | ₹245.00 (trigger) | ₹244.40 | ₹0.60 | 24.5 | ₹120 |
| 3 | XYZ | Buy | Limit | 100 | ₹480.00 (ask) | ₹479.95 | −₹0.05 | −1.0 | −₹5 |
| 4 | PQR | Buy | Limit | 150 | ₹120.00 (ask) | Not filled | n/a | n/a | n/a |
The symbols and prices are hypothetical. The three filled orders cost ₹155 on ₹1,47,000 of reference value, about 10.5 basis points. The unfilled order is a separate item, not a zero. A draft slippage audit ledger workbook holds these fields with formulas.
Capture the Right Fields
- Date and time, symbol and side
- Order type and quantity (and multiplier, for derivatives)
- Reference price and its source
- Average fill price, or "not filled"
- Fees, kept in their own column
- Market condition, such as quiet, fast or around an announcement
The Neostox reports page says the Detailed Trading Report can be downloaded to Excel. Check its columns, and if it has no reference quote, record that yourself at order time.
Slippage in Paper Trading and Backtesting
Simulated fills follow a rule, and that rule is not the market. A backtest that assumes ideal fills can overstate a strategy, and a paper account can understate costs for similar reasons. Say whether your slippage is observed from fills or assumed as a fixed allowance. Neither proves how live execution would go.
Why Simulated Fills Differ
- A fill rule decides the price. A simulator may fill at the last traded price, the bid or ask, or something else.
- Your order does not move the market. Real orders can consume depth; simulated ones often do not.
- Timing differs. Data and order timing in a simulator may not match live conditions.
- Partial fills, non-fills and gaps may be simplified.
The paper trading vs real trading guide covers these differences more broadly.
A fixed allowance is a sensitivity test. The table applies hypothetical allowances to a hypothetical strategy: 50 trades of 200 shares, each averaging ₹120 before slippage, with the allowance charged on both entry and exit.
| Scenario | Allowance per side | Cost per round trip | Net per trade | Total over 50 trades |
|---|---|---|---|---|
| No slippage | ₹0.00 | ₹0 | ₹120 | ₹6,000 |
| A | ₹0.05 | ₹20 | ₹100 | ₹5,000 |
| B | ₹0.15 | ₹60 | ₹60 | ₹3,000 |
| C | ₹0.30 | ₹120 | ₹0 | ₹0 |
At ₹0.30 per side, the hypothetical strategy breaks even. These allowances are not typical values and do not predict live results. The aim is to find how much slippage your strategy can absorb.
Does Slippage Vary by Asset and Strategy?
Yes. Slippage depends on the instrument, the order size and how often you trade, so no general average fits every case and quoting one would mislead. What changes is the unit you measure in and the conditions you trade in.
| Context | What changes |
|---|---|
| Stocks | Price steps and liquidity differ widely by stock; liquid names usually have tighter spreads |
| Futures and options | Quantity is lots × lot size; option spreads can be wide relative to the premium |
| Forex (where offered) | Moves are often quoted in pips, so convert to a common unit |
| Crypto | Some venues use a slippage tolerance setting rather than a single fill price |
| Scalping | Many small trades, so a tiny per-trade cost adds up |
| Swing trading | Fewer trades, but overnight gaps matter more |
Conclusion
Measure first: pick a benchmark, record the reference, and calculate one consistent number for every fill. Then diagnose which orders, instruments and conditions cost you most. Then reduce, by choosing order types and sizes deliberately and by testing allowances against your results. Keep slippage separate from spread and charges.