
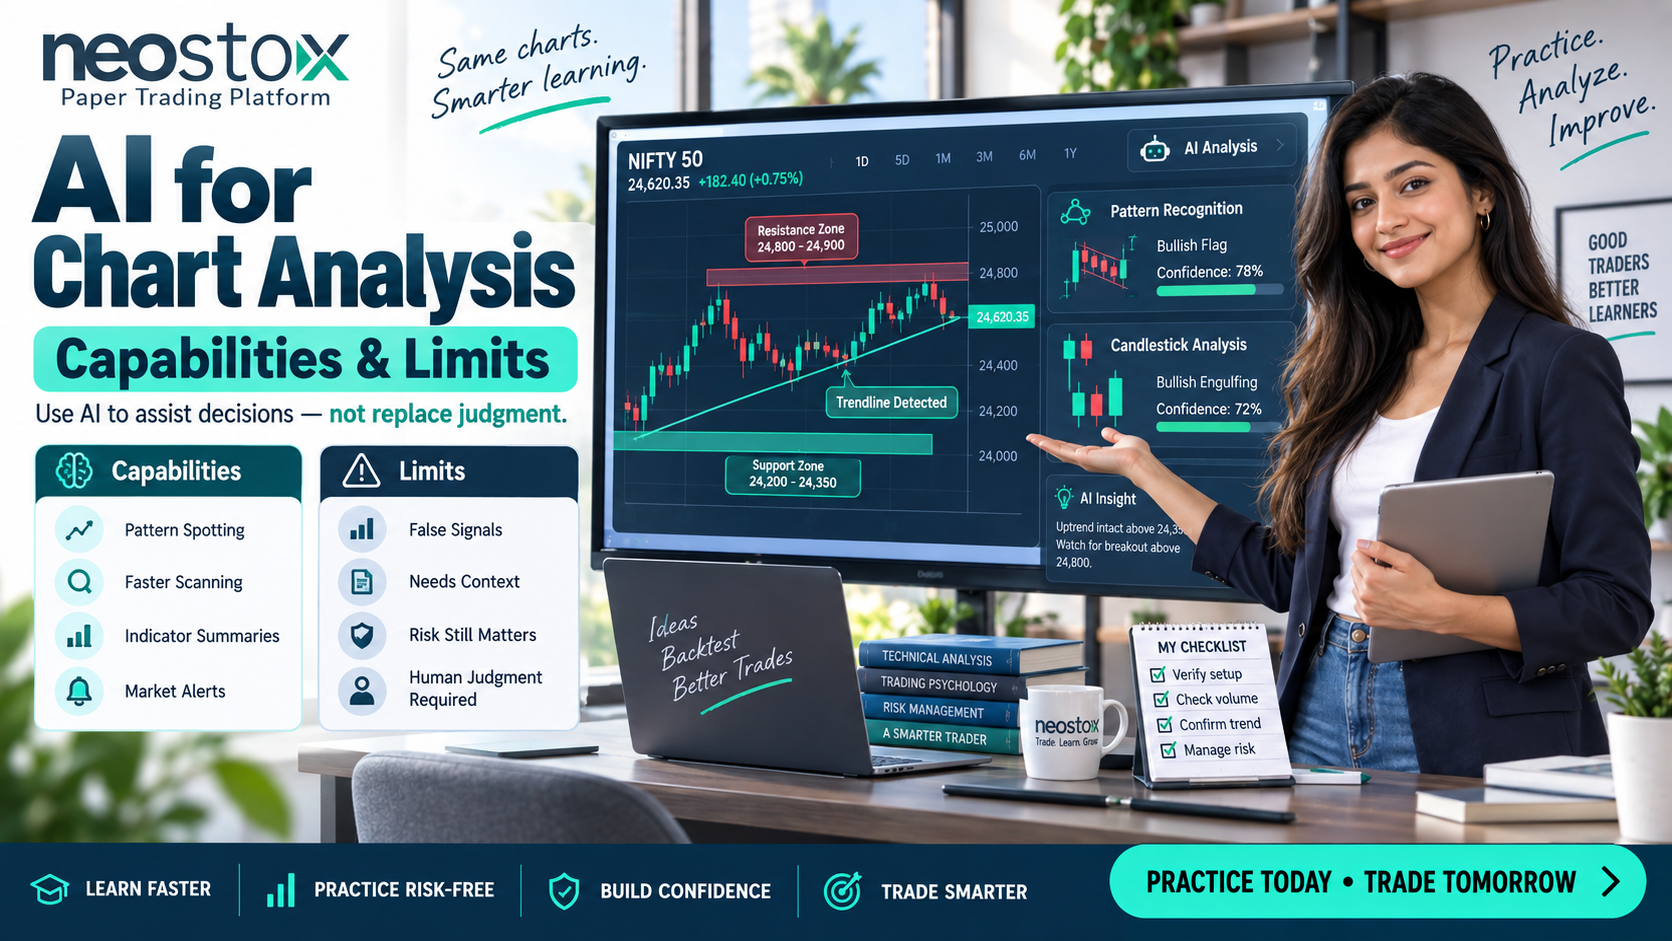
What can AI actually detect on a trading chart?
Pattern recognition is the core capability, and it works in two main ways. Rule-based systems scan price and volume data looking for shapes matching a predefined mathematical definition of a pattern, a head and shoulders, a triangle, a specific candlestick formation, and flag matches across hundreds or thousands of stocks far faster than manual scanning ever could. Machine learning models, trained on labeled historical examples, can go a step further, learning to recognize patterns even when they don't match a rigid textbook shape exactly.
Beyond named patterns, AI tools commonly detect support and resistance clusters by analyzing where price has repeatedly reacted, flag unusual volume spikes that might signal something worth investigating, and identify trend shifts algorithmically rather than by eye. The genuine strength here is speed and consistency, scanning a large universe of stocks tirelessly, applying the exact same criteria every single time, something no human analyst can match across hundreds of charts in real time.
What inputs does AI chart analysis actually need?
Clean historical OHLCV data, open, high, low, close, and volume, is the baseline requirement for nearly any approach, and data quality matters more than people expect. Gaps, errors, or inconsistent formatting in that historical data quietly degrade whatever pattern detection you build on top of it.
Machine learning approaches specifically need enough historical examples to actually learn from, and for supervised methods, those examples usually need to be labeled, meaning someone has to have confirmed "yes, this was a genuine head and shoulders that played out as expected" across enough historical instances for a model to learn the pattern reliably. Sufficient liquidity in whatever you're analyzing matters too, since patterns detected on thin, rarely traded stocks tend to be less reliable regardless of how sophisticated the detection method is.
How accurate is AI-based chart analysis compared with manual technical analysis?
There's no single, verified accuracy figure that applies universally, and any tool quoting you a fixed percentage, "94% accurate pattern detection", deserves real skepticism, since accuracy depends heavily on the specific model, the market conditions it's being applied in, and exactly how the pattern was defined algorithmically in the first place. What can be said honestly: AI is more consistent than manual analysis at applying the same rule identically across many charts, since it doesn't get tired or start seeing patterns that aren't really there the way a human eye can after hours of screen time.
What AI doesn't automatically improve is the underlying reliability of the pattern itself. A head and shoulders flagged by an algorithm carries the same fundamental uncertainty a manually spotted one does, since both are probability tools, not guarantees, and both fail regularly regardless of who or what spotted them. The real question isn't "AI versus manual," it's whether either approach has actually been validated properly, covered next.
Can AI analyze trading charts and identify chart patterns automatically?
Yes, mechanically, this is genuinely one of the more mature applications of AI in trading. Automated scanners can flag pattern matches across a large universe of stocks continuously, something that would take a human analyst hours to do manually across even a fraction of the same coverage.
What "identify" doesn't automatically include is correct interpretation. A pattern flagged by an algorithm still needs the same context a manually spotted one does, what's the broader trend, what does volume look like at the relevant points, does the pattern make sense given what's actually happening with the stock right now. Automated detection handles the finding, it doesn't replace the judgment step that determines whether a flagged pattern is actually worth acting on.
The workflow: how AI chart analysis actually gets validated
Detection alone isn't the finish line, and treating it as one is how false confidence creeps into an AI-assisted process. A proper workflow looks something like this.
- Define the pattern or train the model: Either code explicit rules for what counts as a valid pattern, or train a model on a genuinely large, accurately labeled historical dataset.
- Backtest across varied historical conditions. Run the detection method against historical data spanning trending, choppy, and volatile periods, not just one favorable stretch, since a method that only works in one type of market hasn't been properly tested.
- Check the false positive rate specifically: How often does the tool flag a pattern that doesn't actually play out as expected? This number matters as much as the "hit rate" on patterns that did work, and it's often the number vendors talk about least.
- Paper trade the validated signals before acting on them with real capital: Even a backtested, seemingly reliable detection method behaves differently in live, forward-moving conditions than it does in a historical backtest, so testing it forward with virtual money is a necessary extra step, not an optional one.
- Keep a human review step in the loop: AI doesn't see breaking news, doesn't know about an upcoming earnings call unless that data's explicitly fed in, and doesn't understand context the way a person scanning the same chart alongside current events would. A flagged pattern deserves a quick human sanity check before you act on it, not blind trust.
Skipping straight from "the AI flagged this" to placing a trade is where a lot of the risk in this whole approach actually lives.
Can I automate chart pattern detection without coding?
Yes, to a meaningful degree. Many trading platforms now include built-in screeners and scanners with preset pattern detection, letting you filter for specific setups, breakouts, particular candlestick formations, unusual volume, without writing a single line of code. Neostox's NeoScreener and AI options assistant work this way, giving you automated screening and options-specific analysis support without requiring any programming background.
Deeper customization, building your own pattern definitions from scratch or training a model on your own labeled data, generally does require coding, most commonly in Python given its strong ecosystem for this kind of analysis. But for most retail traders, a good no-code screener covers a large share of what automated detection is actually useful for day to day.
How can Python or machine learning be used to analyze charts and generate signals?
For anyone building this from scratch, a fairly standard toolkit has emerged. Libraries like pandas handle the underlying OHLCV data manipulation, libraries like TA-Lib or pandas-ta calculate standard technical indicators without needing to code the math yourself, and libraries like scikit-learn support building classification models that estimate the probability of a pattern or setup playing out based on historical examples.
The general workflow mirrors the validation steps above: gather and clean historical data, engineer features, moving averages, volatility measures, volume ratios, from that raw price data, train a model to recognize patterns or predict outcomes, then rigorously backtest and validate out-of-sample before trusting any signal it generates. This is a genuinely deep technical area, and getting it right takes real statistical care, particularly around avoiding overfitting, building a model so closely tuned to historical data that it fails to generalize to new, real conditions.
What should you actually look for in an AI charting tool?
Rather than chasing a specific brand name, since tools and their claimed capabilities shift constantly, judge any AI charting tool against a few honest criteria. Does it show you its backtested performance across varied market conditions, not just a single favorable period? Does it report false positive rates, not just successful flags? Can you paper trade its signals before committing real capital? And does it avoid claiming a fixed, guaranteed accuracy percentage, since no legitimate tool can promise that given how much markets shift?
A tool that's transparent about its limitations is generally more trustworthy than one only showing you its wins.
The honest limitations, and where human oversight still matters
AI-detected patterns carry the same structural limitations manually spotted ones do, they're probability tools, not certainties, and they fail regularly. On top of that, AI models specifically risk overfitting, becoming so closely tuned to historical data that they perform worse on genuinely new conditions than the backtest suggested. Markets are also non-stationary, meaning the statistical relationships a model learned from past data can shift meaningfully as conditions change, without the model necessarily knowing it's now operating outside what it learned from.
None of this means AI-assisted chart analysis isn't useful, it clearly is, for speed, consistency, and covering far more ground than manual scanning allows. It means treating a flagged pattern as a starting point for your own judgment, not a finished decision, particularly around news events, earnings, and context an algorithm simply isn't seeing.
Neostox's AI options assistant and NeoScreener give you automated screening and options-specific support without needing to code anything yourself, and paper trading lets you validate any AI-flagged setup with virtual money on live NSE and BSE market conditions before real capital is involved. Detection is the easy part. Validation is what actually makes it useful.