
The exercise rehearses a decision process. It does not predict real gaps or real fills. Jump to the seven steps, the worked example or the gap-size table. All rupee amounts are hypothetical illustrations, not recommendations.
What Is Overnight Gap Risk?
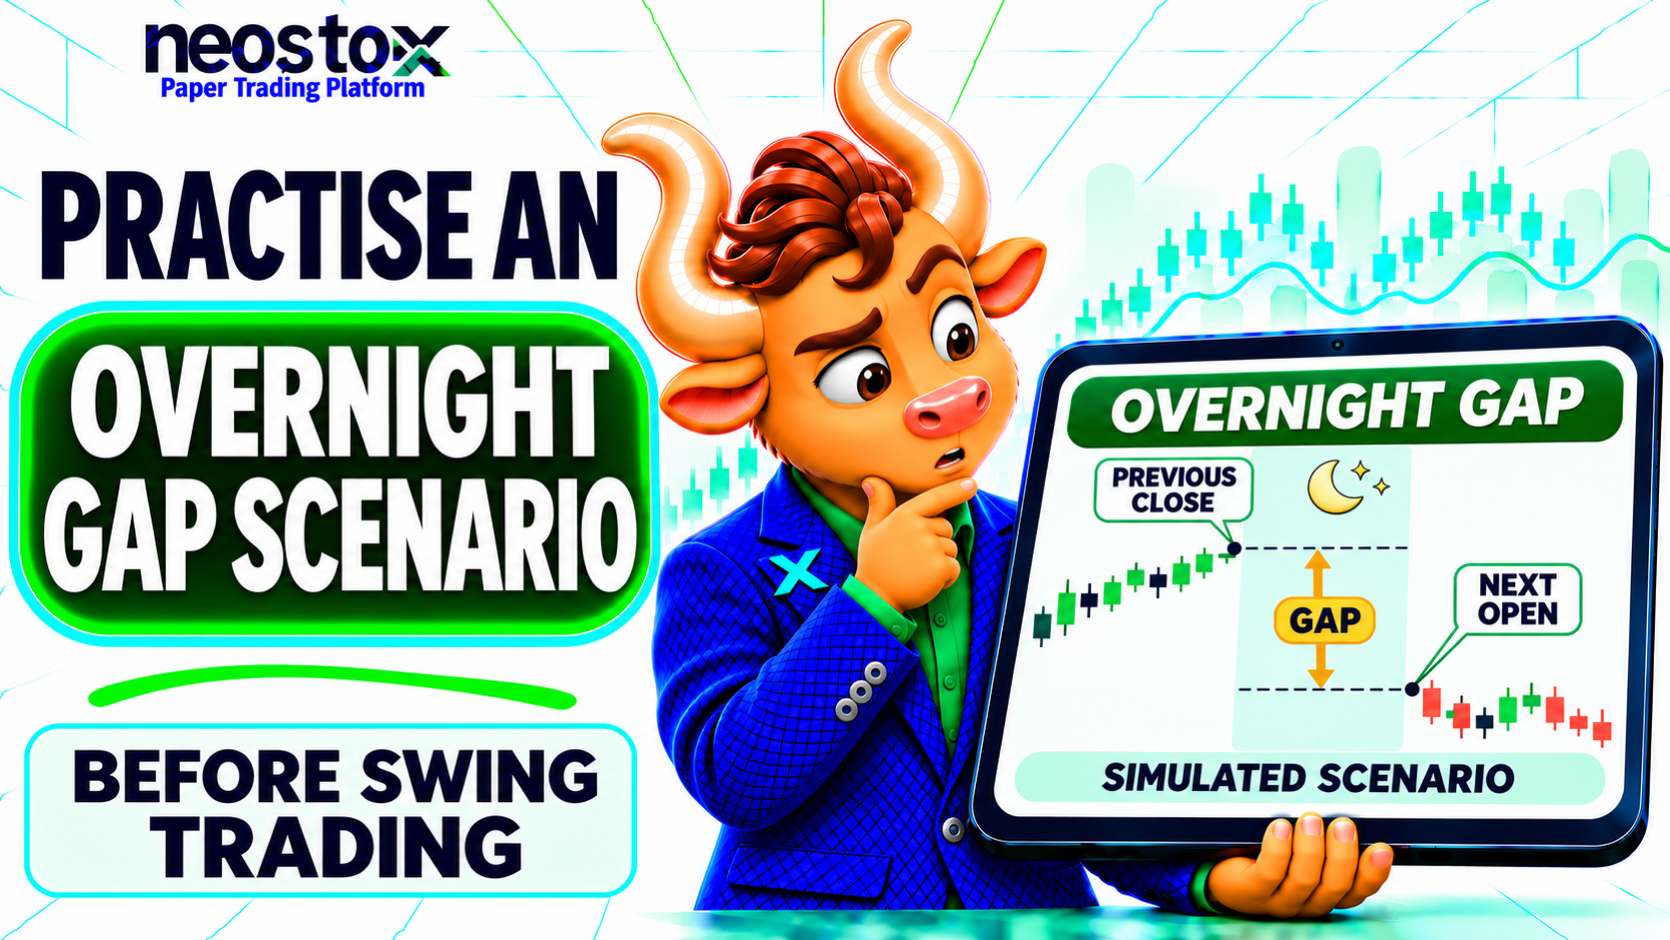
An overnight gap is the difference between one session's closing price and the next session's opening price. Because nothing trades in between, the open can land well beyond a stop-loss level, so the loss can exceed the amount you planned to risk. A gap can also be favourable.
Whether a gap helps or hurts depends on your side:
| Position | The next open is | Result |
|---|---|---|
| Long (bought) | Below the previous close | Adverse |
| Long (bought) | Above the previous close | Favourable |
| Short (sold) | Above the previous close | Adverse |
| Short (sold) | Below the previous close | Favourable |
Why a Stop-Loss Does Not Cap an Overnight Loss
A stop order does not guarantee a fill at its stop price. If the next open is beyond that level, a triggered stop-market order generally executes near the open, not at the stop. A stop-limit order may not fill at all. Check how your platform treats orders held overnight.
The stop-loss market vs stop-loss limit guide compares the two order types. A gap is also a source of slippage, which is why this exercise measures the gap through the stop.
Why Practise Gap Risk in Paper Trading?
A simulated account lets you see a gap through your own stop without real capital exposed to the orders. You learn how large the surprise can be, how it compares with your plan and what it does to a daily loss budget. The useful result is a documented process, not a prediction.
The exercise has limits. A simulator may not reproduce the opening auction (where a market has one), the spread at the open or the liquidity available. It does not reproduce the feeling of a real loss either. Verify order behaviour in your platform's help pages, and read the paper trading vs real trading guide for the wider gap between the two.
Before You Start: Rules and Assumptions
Fix the rules before you place the trade, so the result cannot change your method afterwards. This guide uses one simple convention, and the worksheet applies it to every row.
| Item | Rule used in this guide |
|---|---|
| Measurement point | The next session's opening price |
| Stop triggered | Long: open at or below the stop. Short: open at or above it |
| Stop-market fill | Assumed to fill at the open |
| Stop-limit fill | Fills at the open only if the open is at or better than the limit |
| P&L | From your entry price to the open, before fees and taxes |
| Loss multiple | Loss ÷ planned risk. Above 1.0 means the loss beat the plan |
Questions to Check on Your Platform
- Can a position be held overnight, and do your orders stay active between sessions?
- How is a triggered stop priced when the open is beyond it?
- Is the data real-time or delayed? Delays change what you can compare.
- Does it show open and closed results separately?
Do not assume the answers. A platform may differ from this guide's convention, and your results should say which rule applied.
The Exercise: Seven Steps
- Write the plan before the close. Record the symbol, side, quantity, entry, stop, stop type (market or limit) and why you are taking the trade.
- Size the position. Planned risk is capital × risk %. Quantity is planned risk ÷ the distance from entry to stop, rounded down.
- Choose a test gap. Pick a hypothetical gap, such as 4% of the previous close, and label it an assumption, not a forecast.
- Hold overnight and record the previous close. Note the closing price and your open orders, and keep a screenshot if your platform allows one.
- Record the next open. Note whether the stop triggered and whether it filled.
- Calculate the result. Use the formulas below.
- Review. Compare the loss with your plan and your daily limit. Write one change you would make, then repeat in different conditions.
Gap per share = next open − previous close
Gap % = gap per share ÷ previous close × 100
Planned risk = quantity × |entry − stop|
P&L (Long) = (open − entry) × quantity
P&L (Short) = (entry − open) × quantity
Gap through stop = (stop − open) × quantity [Long, if open ≤ stop]
 = (open − stop) × quantity [Short, if open ≥ stop]
Loss multiple = loss ÷ planned risk
Worked Example: One Position, Four Overnight Outcomes
The example follows a single trade into four possible mornings.
- A paper account of ₹1,00,000 risks 1% (₹1,000) per trade.
- You buy 200 shares of a hypothetical stock at ₹250.00 with a stop-loss at ₹245.00. Planned risk is ₹5.00 × 200 = ₹1,000, and the position is worth ₹50,000.
- The previous close is ₹250.00.
- A stop-market order fills at the open. The stop-limit variant has a limit of ₹244.50.
- Fees and later price moves are ignored.
| Outcome | Next open | What happens | P&L at the open | Loss ÷ plan |
|---|---|---|---|---|
| A: small gap | ₹249.00 (−0.40%) | Stop not triggered; position stays open | −₹200 (floating) | 0.2 |
| B: gap through the stop | ₹240.00 (−4.00%) | Stop-market fills at ₹240.00 | −₹2,000 (realised) | 2.0 |
| C: same gap, stop-limit | ₹240.00 (−4.00%) | Stop triggers, but the open is below the ₹244.50 limit, so no fill | −₹2,000 (floating) | 2.0 |
| D: favourable gap | ₹256.00 (+2.40%) | Stop not triggered | +₹1,200 (floating) | n/a |
In outcome B, the planned ₹1,000 loss became ₹2,000. The stop was ₹5.00 below entry, but the open was ₹10.00 below it, so ₹5.00 per share (₹1,000) fell through the stop. In outcome C the stop-limit avoided selling at ₹240.00, but the position stayed open and unprotected. That is a different risk, not a safer one.
Same Entry, Two Position Sizes
Repeating the same entry at a smaller size shows how the rupee loss scales. The loss multiple does not change, because it depends on the gap and the stop distance, not on quantity.
| Plan 1 (1% risk) | Plan 2 (0.5% risk) | |
|---|---|---|
| Quantity | 200 | 100 |
| Planned risk | ₹1,000 | ₹500 |
| Loss if the open is ₹240.00 | ₹2,000 | ₹1,000 |
| Loss ÷ planned risk | 2.0 | 2.0 |
| Share of a ₹2,000 daily limit | 100% | 50% |
Linking the Gap to a Daily Loss Limit
Take a 2% daily limit on ₹1,00,000, which is ₹2,000. Outcome B uses all of it in one opening print. Whether it counts depends on the rule: its starting value, whether floating losses are included and how overnight positions are treated. Outcome C shows why this matters, because the ₹2,000 loss is still open. Realised vs unrealised P&L explains the difference. The paper trading daily loss limit rule covers the thresholds in more detail.
Gap Sensitivity: How Big a Gap Breaks Your Plan?
The same position can be tested against a list of gap sizes. With the stop 2% below the previous close, any gap larger than 2% loses more than the plan.
| Gap vs previous close | Next open | P&L at the open | Loss ÷ plan | Share of daily limit | Stop triggered? |
|---|---|---|---|---|---|
| −6% | ₹235.00 | −₹3,000 | 3.0 | 150% | Yes |
| −4% | ₹240.00 | −₹2,000 | 2.0 | 100% | Yes |
| −2% | ₹245.00 | −₹1,000 | 1.0 | 50% | Yes |
| −1% | ₹247.50 | −₹500 | 0.5 | 25% | No |
| 0% | ₹250.00 | ₹0 | n/a | n/a | No |
| +2% | ₹255.00 | +₹1,000 | n/a | n/a | No |
| +4% | ₹260.00 | +₹2,000 | n/a | n/a | No |
These gap sizes are test values, not typical ones. You can also size backwards from a gap. To keep a 4% gap within a ₹1,000 budget, divide the budget by the loss per share: ₹1,000 ÷ (₹250 × 4%) = ₹1,000 ÷ ₹10 = 100 shares, half the original size. The trade-off is that smaller positions also earn less when the market goes your way.
Variations to Repeat
Change one input at a time and keep the same journal.
| Variation | What it teaches | Hypothetical result |
|---|---|---|
| Short position | A gap up is adverse | Short 100 at ₹100, stop ₹104, open ₹108: −₹800, 2.0× the ₹400 plan |
| Stop-limit instead of stop-market | Price control can mean no exit | Outcome C above |
| Wider or tighter stop | Stop distance changes both size and the gap through it | Re-run the sensitivity table |
| Several positions | A market-wide gap can hit many at once | Three ₹50,000 positions with a 4% adverse gap: −₹6,000, or 6% of the account |
| Before a scheduled announcement | Event gaps can differ from quiet ones | Record the context beside each row |
Record and Review Your Results
A ledger turns four exercises into data you can compare. Record the same fields each time, then total them.
| Symbol | Side | Qty | Entry | Stop | Prev. close | Open | Status | P&L | Loss ÷ plan |
|---|---|---|---|---|---|---|---|---|---|
| ABC (A) | Long | 200 | ₹250.00 | ₹245.00 | ₹250.00 | ₹249.00 | Open | −₹200 | 0.2 |
| ABC (B) | Long | 200 | ₹250.00 | ₹245.00 | ₹250.00 | ₹240.00 | Stopped out | −₹2,000 | 2.0 |
| ABC (C) | Long | 200 | ₹250.00 | ₹245.00 | ₹250.00 | ₹240.00 | Stop-limit not filled | −₹2,000 | 2.0 |
| ABC (D) | Long | 200 | ₹250.00 | ₹245.00 | ₹250.00 | ₹256.00 | Open | +₹1,200 | n/a |
These four rows are illustrations, not test results. Three of the four gaps were adverse, two triggered the stop, and one order did not fill. The net result at the open is −₹3,000, mixing realised and floating P&L. A draft overnight gap exercise worksheet applies the same formulas to your own rows.
The Neostox reports page says the Detailed Trading Report can be downloaded to Excel. Check which columns it contains. If it lacks the previous close or the open, record them yourself.
A few overnight trades describe your process, not the odds of a gap. Do not draw conclusions about how often gaps happen from a handful of rows. Pair this with the first-trade journal guide for the rest of the fields.
How to Reduce Overnight Gap Risk
You cannot remove gap risk while a position is open overnight. You can reduce it, and each option has a cost.
- Hold a smaller position. The rupee loss from a gap scales with size, but so do gains.
- Size to a gap allowance. Plan for a gap beyond your stop, not just the stop distance.
- Avoid holding through scheduled announcements. You may miss a favourable move.
- Close before the session ends. This removes the overnight exposure and the overnight opportunity.
- Do not rely on diversification for market-wide gaps. Many positions can gap together.
- Choose the stop type on purpose. A stop-market order is likely to fill but possibly far away. A stop-limit order controls price but may not fill.
The swing trading risk guide covers overnight exposure for swing traders. Use the stop-loss practice guide to rehearse the order itself.
What the Exercise Cannot Show
- Real opening conditions. Spreads and available quantity at the open can differ from a simulator's fill.
- Real partial fills. A large real order may fill in parts at several prices.
- Your behaviour with real money. Losses on paper do not feel the same.
- How often gaps occur. A short exercise is not a statistical study.
Conclusion
Practise the gap the way you practise the stop: write the plan, hold the position, record the open and measure the loss against your plan. Then size, choose stop types and set daily limits with the gap in mind. The result is a documented process, not a forecast.