
What is technical analysis? How do I learn it for Indian stocks?
Technical analysis means studying price and volume history, through charts, patterns, and indicators, to understand market behavior and inform trading decisions, rather than analyzing a company's underlying business. It rests on the idea that price action reflects the combined behavior of everyone trading a stock, and that certain patterns in that behavior tend to repeat.
Learning it properly follows a specific sequence, market mechanics first, then candlesticks, then support and resistance, then trend, then patterns, then indicators, each stage building on the one before it. A companion guide on this site walks through that full eight-stage roadmap in depth, worth following in order rather than jumping straight to indicators, which is where most beginners go wrong.
Technical vs fundamental analysis?
These are genuinely different lenses, not competing philosophies, and most experienced market participants understand both to some degree even if they lean on one more heavily. Technical analysis studies price and volume behavior, chart patterns, momentum, trend, to time entries and exits, largely indifferent to why a stock's business is doing well or poorly. Fundamental analysis studies the actual business, revenue, earnings, debt, competitive position, valuation, to judge whether a company is worth owning, largely indifferent to short-term price wiggles along the way.
Which one matters more depends heavily on your time horizon. Day and swing trading lean heavily technical, since the holding period is too short for business fundamentals to meaningfully shift. Position trading blends both, leaning more fundamental than swing trading. Long-term investing leans almost entirely fundamental, since short-term technical noise matters far less across a multi-year holding period. Neither approach is more "correct" in isolation, they answer different questions, when to trade versus what to actually own.
What are support and resistance?
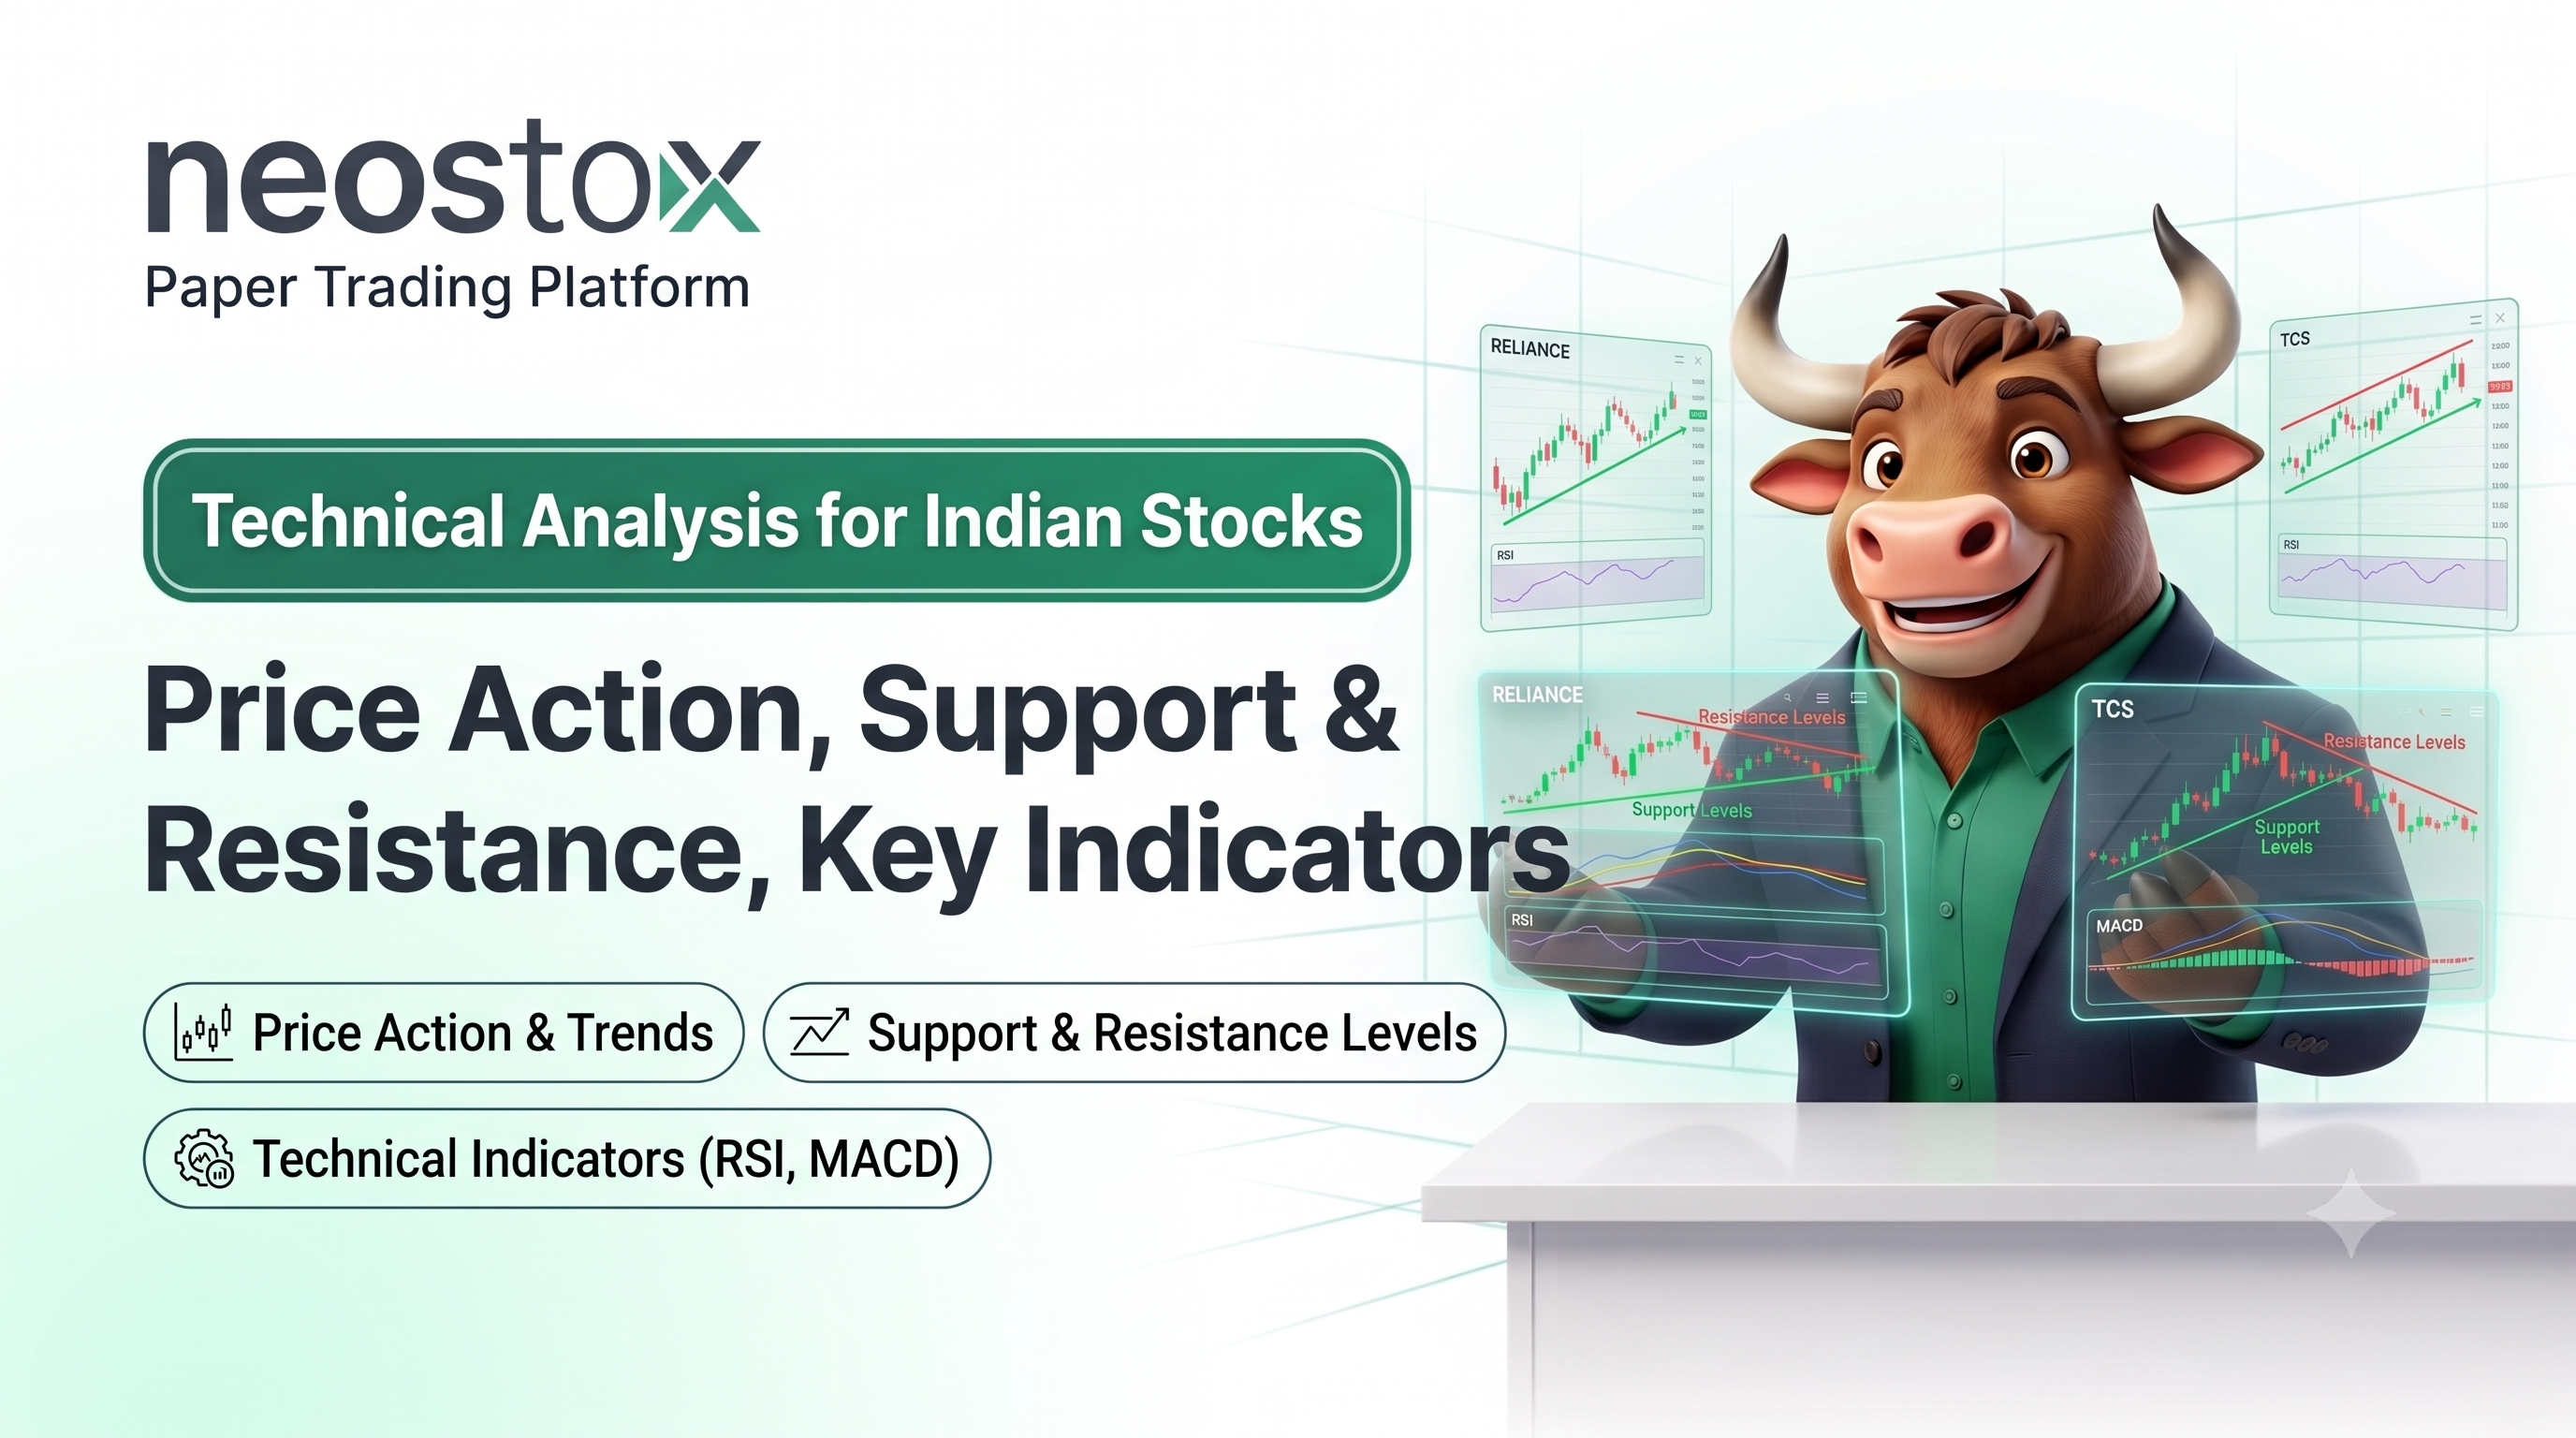
Support is a price level where buying pressure has repeatedly stepped in to stop a decline. Resistance is the mirror, a level where selling pressure has repeatedly capped an advance. Once you can spot these reliably, most chart patterns and technical setups start making a lot more sense, since they're largely built around price testing and reacting to these levels. A companion guide on chart patterns covers exactly how these levels combine into specific, recognizable setups.
What is RSI? What are moving averages?
RSI (Relative Strength Index) measures momentum, how fast and how far price has moved recently, on a 0 to 100 scale, commonly used to gauge overbought or oversold conditions. Moving averages measure trend direction, smoothing out day-to-day noise to show the broader path price has actually been taking. A dedicated companion guide covers both, alongside MACD, ATR, and volume, specifically framed around what each tool actually measures, worth reading for the full picture.
What does volume tell traders?
Volume measures market participation, how many shares are actually changing hands, not price direction itself. A price move on strong volume reflects genuine conviction, the same move on weak volume is a far less trustworthy signal, more likely to fade or reverse.
What are candlestick patterns?
Candlestick patterns are specific, recognizable shapes formed by one or more candles, each representing the open, high, low, and close for a given period, that traders use to read short-term shifts in buying or selling pressure. Broader chart patterns, built from many candles over a longer stretch, are a related but distinct concept, covered along with a full breakdown of both reversal and continuation patterns in two dedicated companion guides on this site.
Which indicators should a beginner understand first?
Fewer than you'd think, genuinely. Start with support and resistance and basic trend identification, both readable directly from price without any indicator at all, before adding a moving average or two, then RSI or MACD once trend and price action feel comfortable. Stacking many indicators at once tends to produce conflicting signals rather than clarity, a pattern covered in more depth in the dedicated indicators guide.
Should traders combine indicators or use price action? Can indicators predict the market?
Most experienced traders use both, price action as the primary read, indicators as confirmation, rather than picking one exclusively. Indicators are mathematically derived from the same price and volume data you can already see on the chart, they summarize and confirm what's happening, they don't predict what happens next with any certainty.
Treat every indicator, and every pattern, as a probability tool, not a guarantee. Markets move based on constantly shifting conditions no single tool fully captures, which is exactly why testing any approach across a real sample of trades matters more than trusting a single signal in isolation.
Want to go deeper?
This page covers the foundation. Dedicated guides on this site go further into every piece: the full eight-stage learning roadmap from mechanics through to a tested process, indicators explained by what each one actually measures with guidance on combining them without redundancy, chart patterns broken down by reversal and continuation types across twenty named formations, and advanced techniques like Renko charts, Market Profile, and multi-timeframe analysis for once the basics feel solid.
Reading a chart accurately is a skill built through repetition, not a glossary. Neostox's charting tools let you study price action, support and resistance, indicators, and patterns across equities, futures, and options on live NSE and BSE market conditions, and paper trading gives you a place to practice reading and reacting to real price behavior with virtual money before any of it matters with real capital.